--include-dist option reads the dist/ folders where published npm packages keep their code · used by the AI Threat Index
LOG KEEPER — v2.2.1: log keeper: keeps a copy of your coding agents’ logs before the agents delete them — Claude Code deletes its transcripts after 30 days by default — after log-in or daily, compressed, never deleting · protected folders refused · Agent Tracer on Windows now reads and writes UTF-8 · IT guide
AI AGENT TRACER — v2.2.0: reads the session logs your coding agents write — Claude Code, Codex, Cursor, Copilot CLI, Gemini CLI and Google Antigravity — and reports what they ran, deleted, pushed and sent, which model did it and what you refused, with a since-last-run block on top · offline, nothing sent
AGENT SCAN ACROSS 22 LANGUAGES — v2.1.1: every text file read at a stated level — full rules in 22 languages plus web-page scripts and notebooks · agent CLIs launched with their checks off, encoded prompts and hidden hosts, local models with no URL in the file: the three 2025 attack shapes found by name · churn now measures Julia, Lua and Elixir — 62 languages · tested on 25 public repositories · the licence check no longer stalls every run · the Agent Scan page · download
ENCODED PAYLOADS AND A FASTER, STRICTER AGENT SCAN — v2.0.2: a second pass decodes base64, hex and compressed literals and rates hidden AI code that the file executes CRITICAL · the rogue-agent pattern is CRITICAL in every scanned language · Ruby and C# false CRITICALs removed · agent scan start-up 25 s → 0.1 s on a 115 MB tree · Metrics + Agent Scan runs from the GUI again · every demo opens an in-tool source page verified against a frozen baseline · download
VERSION 2.0.1 — v2.0.1: the metric definitions moved (a move is not churn, braces never count, unclassified text out of the totals) so 1.9 and 2.0 numbers are not comparable · 114 known-answer fixtures behind the engine · every headless mode licence-gated · the Action reads its gate rules from the base branch · download
SECURITY RELEASE — v1.9.9: AI-BOM provider counts made exact (one provider however the code spells it; frameworks reported separately) · the agent map folds to match · committed credentials, build surface and the AI-vs-exec-only split now in the machine-readable JSON · download
CODE DELTA THREAT DETECTION AND CODE SECURITY TOOL PORTFOLIO — EXPANDED AND UPGRADED — v1.9.8: committed credentials found and shown redacted · merge gates for credentials, new install hooks and new remote-fetching build files · download-URL deltas on fetching build files · Agents mode in the Code Browser with the 3-D agent map as a first-class view · download
MULTI-CORE ENGINE — new in v1.9.7: scans use every core with byte-identical results — large scans roughly halved — plus Code Browser inheritance, a sortable class-complexity view and a density dial on the class visualiser · download
BUILD-FILE ALERTS — new in v1.9.6: a scan that compares two versions now flags every build/CI/packaging file that changed — the xz-utils entry route — install hooks first, in the GUI, the agent report and the PR comment · download
THE CODE BROWSER — new in v1.9.5: the diff and the whole project's structure in one page — Changes, Overview, Files, Classes and Visualiser tabs, a directory tree, a class index with methods at file:line, a 3D include map and a class ego view coloured by this scan's churn · download
THE AUDITED DIFF — new in v1.9.4: a rebuilt diff (now the Code Browser’s Changes tab) where every counter is a claim you can click, walk and cite — plus moves tracked across files and git overlays showing AI provenance, age of destroyed code and per-author churn · download
TRACEABLE NUMBERS — v1.9.3 fixes the PR comment’s generated-file count: it now counts only the generated files that churned in your PR, so the number traces to the diff · download
TRUE_CHURN IN CI — new in v1.9.2: pull-request comments now separate authored churn from generated churn — in a real npm/cli release, 80.1% of the churn came from one lockfile · read the paper
TRUE_CHURN — new in v1.9.1: separating authored code from generated code — lockfile and codegen churn subtotalled, TRUE_CHURN = what your developers actually wrote · plus Agent Infrastructure: rogue agents and committed agent credentials found in your tree · download
NEW PAPER — why LLOC is what really counts: a 35-line file holds 5 working statements, and a 12-line churn was really 1 · read the paper
NEW MEASUREMENT — 28.4% of NVIDIA’s open GPU driver tree is data, not code — single statements up to 3MB · read how it was found
NEW REPORT — six and a half years of Erlang/OTP, measured statement by statement — and what a line counter misses · read the report
WE SCANNED CHROMIUM — 43.5 million lines of code, one command, one laptop · read the report
NEW PAPER — AI-assisted development barely edits code, it replaces it: established projects rework 1 statement in 6, agent-built code 1 in 500 · read Paper C
v1.9.0 released — all non-specified programming languages churned as U_LOC · TOTAL LOC · spreadsheet report columns · full coverage accounting · download
LIVE DEMO — watch CodeDelta report on a real pull request · view on GitHub
BUSINESS LANGUAGE BUNDLE added for the finance industry — COBOL, JCL, PL/I · see the languages
STOP PRESS: free to test (full functionality) until 2027!
GitHub Action — 18 October 2026 — Post-review churn: the PR comment shows how much a pull request changed after review started
v2.5.4 — released 13 October 2026 — Threat Index: spots a hijacked update — the same new, obfuscated code added to several files — and links each file to its churn and Agent Scan detail
v2.5.1 — released 12 October 2026 — AI Log Keeper: saves AI coding agents’ session logs and monitors token consumption · Threat Index
v2.3.2 — released 9 October 2026 — Agent Scan reads every file and finds code hidden in images · obfuscated-code check · CodeDelta GUI displays (option) the exact command line for every run · runs on Windows 11 on ARM
SCAN PUBLISHED PACKAGES — v2.2.2: scan published packages: new --include-dist option reads the dist/ folders where published npm packages keep their code · used by the AI Threat Index
LOG KEEPER — v2.2.1: log keeper: keeps a copy of your coding agents’ logs before the agents delete them — Claude Code deletes its transcripts after 30 days by default — after log-in or daily, compressed, never deleting · protected folders refused · Agent Tracer on Windows now reads and writes UTF-8 · IT guide
AI AGENT TRACER — v2.2.0: reads the session logs your coding agents write — Claude Code, Codex, Cursor, Copilot CLI, Gemini CLI and Google Antigravity — and reports what they ran, deleted, pushed and sent, which model did it and what you refused, with a since-last-run block on top · offline, nothing sent
AGENT SCAN ACROSS 22 LANGUAGES — v2.1.1: every text file read at a stated level — full rules in 22 languages plus web-page scripts and notebooks · agent CLIs launched with their checks off, encoded prompts and hidden hosts, local models with no URL in the file: the three 2025 attack shapes found by name · churn now measures Julia, Lua and Elixir — 62 languages · tested on 25 public repositories · the licence check no longer stalls every run · the Agent Scan page · download
ENCODED PAYLOADS AND A FASTER, STRICTER AGENT SCAN — v2.0.2: a second pass decodes base64, hex and compressed literals and rates hidden AI code that the file executes CRITICAL · the rogue-agent pattern is CRITICAL in every scanned language · Ruby and C# false CRITICALs removed · agent scan start-up 25 s → 0.1 s on a 115 MB tree · Metrics + Agent Scan runs from the GUI again · every demo opens an in-tool source page verified against a frozen baseline · download
VERSION 2.0.1 — v2.0.1: the metric definitions moved (a move is not churn, braces never count, unclassified text out of the totals) so 1.9 and 2.0 numbers are not comparable · 114 known-answer fixtures behind the engine · every headless mode licence-gated · the Action reads its gate rules from the base branch · download
SECURITY RELEASE — v1.9.9: AI-BOM provider counts made exact (one provider however the code spells it; frameworks reported separately) · the agent map folds to match · committed credentials, build surface and the AI-vs-exec-only split now in the machine-readable JSON · download
CODE DELTA THREAT DETECTION AND CODE SECURITY TOOL PORTFOLIO — EXPANDED AND UPGRADED — v1.9.8: committed credentials found and shown redacted · merge gates for credentials, new install hooks and new remote-fetching build files · download-URL deltas on fetching build files · Agents mode in the Code Browser with the 3-D agent map as a first-class view · download
MULTI-CORE ENGINE — new in v1.9.7: scans use every core with byte-identical results — large scans roughly halved — plus Code Browser inheritance, a sortable class-complexity view and a density dial on the class visualiser · download
BUILD-FILE ALERTS — new in v1.9.6: a scan that compares two versions now flags every build/CI/packaging file that changed — the xz-utils entry route — install hooks first, in the GUI, the agent report and the PR comment · download
THE CODE BROWSER — new in v1.9.5: the diff and the whole project's structure in one page — Changes, Overview, Files, Classes and Visualiser tabs, a directory tree, a class index with methods at file:line, a 3D include map and a class ego view coloured by this scan's churn · download
THE AUDITED DIFF — new in v1.9.4: a rebuilt diff (now the Code Browser’s Changes tab) where every counter is a claim you can click, walk and cite — plus moves tracked across files and git overlays showing AI provenance, age of destroyed code and per-author churn · download
TRACEABLE NUMBERS — v1.9.3 fixes the PR comment’s generated-file count: it now counts only the generated files that churned in your PR, so the number traces to the diff · download
TRUE_CHURN IN CI — new in v1.9.2: pull-request comments now separate authored churn from generated churn — in a real npm/cli release, 80.1% of the churn came from one lockfile · read the paper
TRUE_CHURN — new in v1.9.1: separating authored code from generated code — lockfile and codegen churn subtotalled, TRUE_CHURN = what your developers actually wrote · plus Agent Infrastructure: rogue agents and committed agent credentials found in your tree · download
NEW PAPER — why LLOC is what really counts: a 35-line file holds 5 working statements, and a 12-line churn was really 1 · read the paper
NEW MEASUREMENT — 28.4% of NVIDIA’s open GPU driver tree is data, not code — single statements up to 3MB · read how it was found
NEW REPORT — six and a half years of Erlang/OTP, measured statement by statement — and what a line counter misses · read the report
WE SCANNED CHROMIUM — 43.5 million lines of code, one command, one laptop · read the report
NEW PAPER — AI-assisted development barely edits code, it replaces it: established projects rework 1 statement in 6, agent-built code 1 in 500 · read Paper C
v1.9.0 released — all non-specified programming languages churned as U_LOC · TOTAL LOC · spreadsheet report columns · full coverage accounting · download
LIVE DEMO — watch CodeDelta report on a real pull request · view on GitHub
BUSINESS LANGUAGE BUNDLE added for the finance industry — COBOL, JCL, PL/I · see the languages
True Churn is the headline. This page is the rest of the box — the Code Browser, the AI Agent Scan, the AI Code Scan, the GitHub Action, the build-file alert and the desktop app — shown as the screens they actually are. Eighteen screens, one per feature — click any picture to enlarge it.
↓ eighteen screens below ↓Every scan writes one self-contained page that reads the code: five tabs that never leave the screen — Changes (the side-by-side diff, for comparisons), Overview, Files, Classes and Visualiser — with the browser’s Back button and a breadcrumb on every screen. A single-project scan gets the same page without the Changes tab.
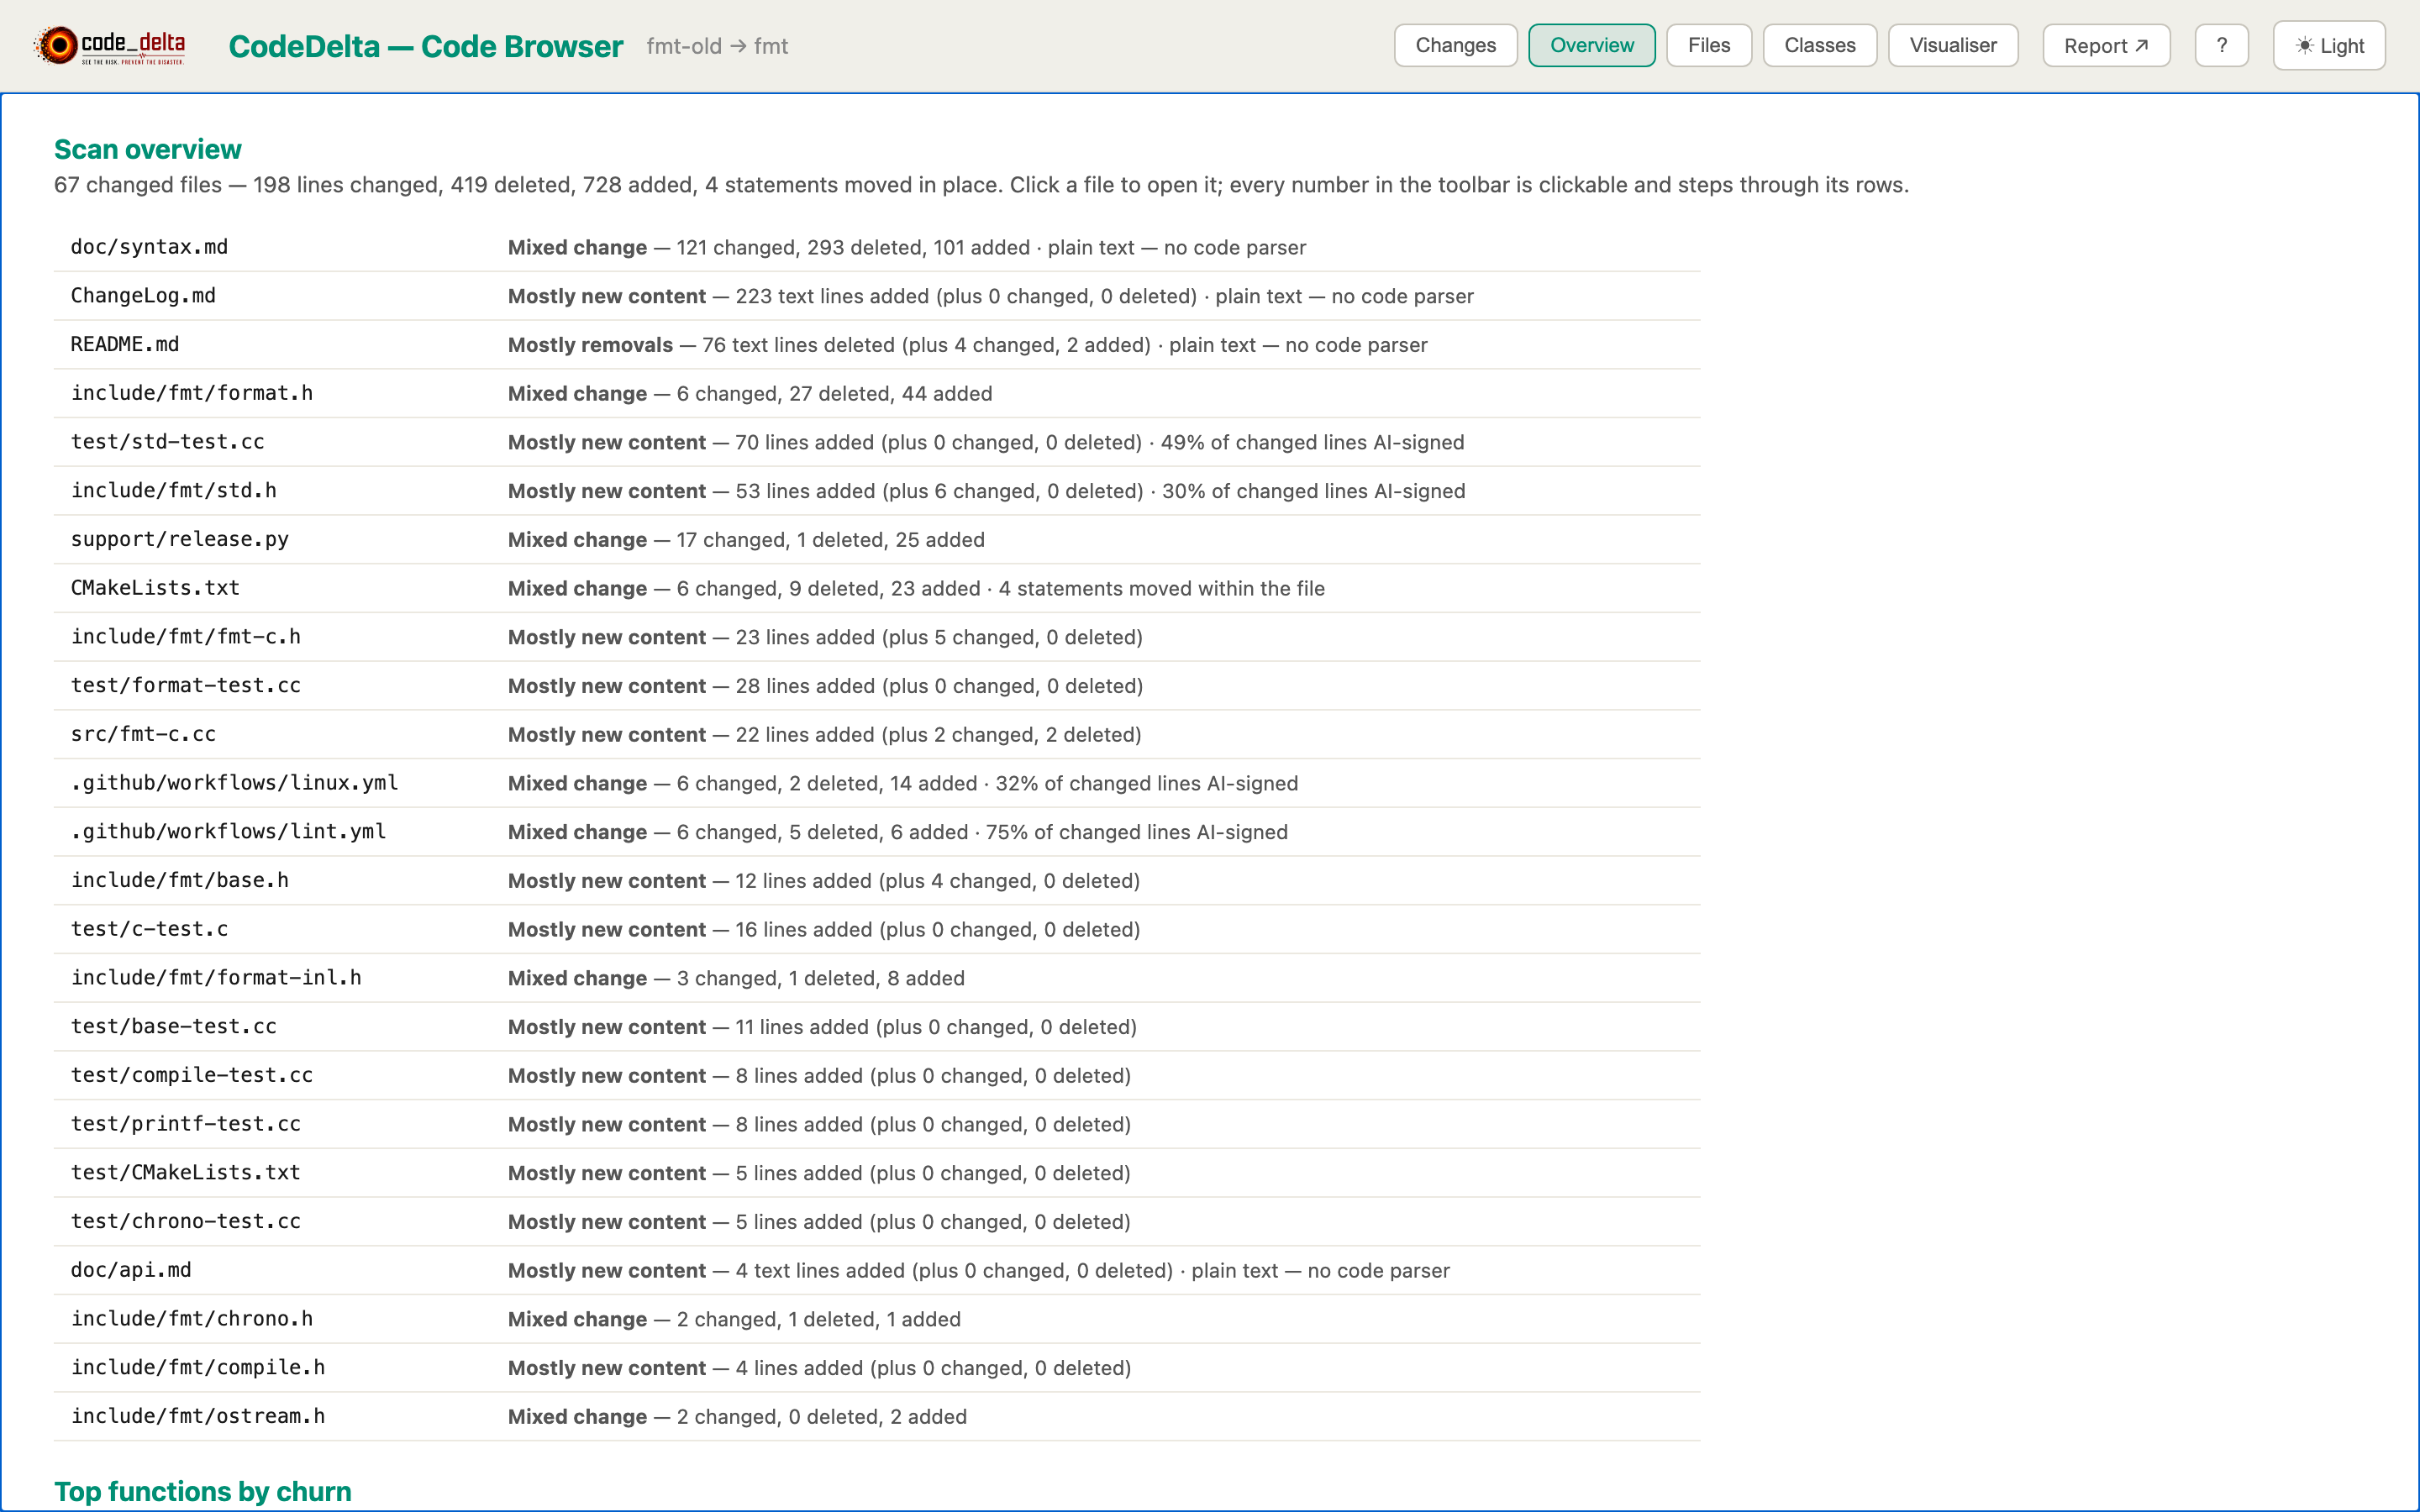
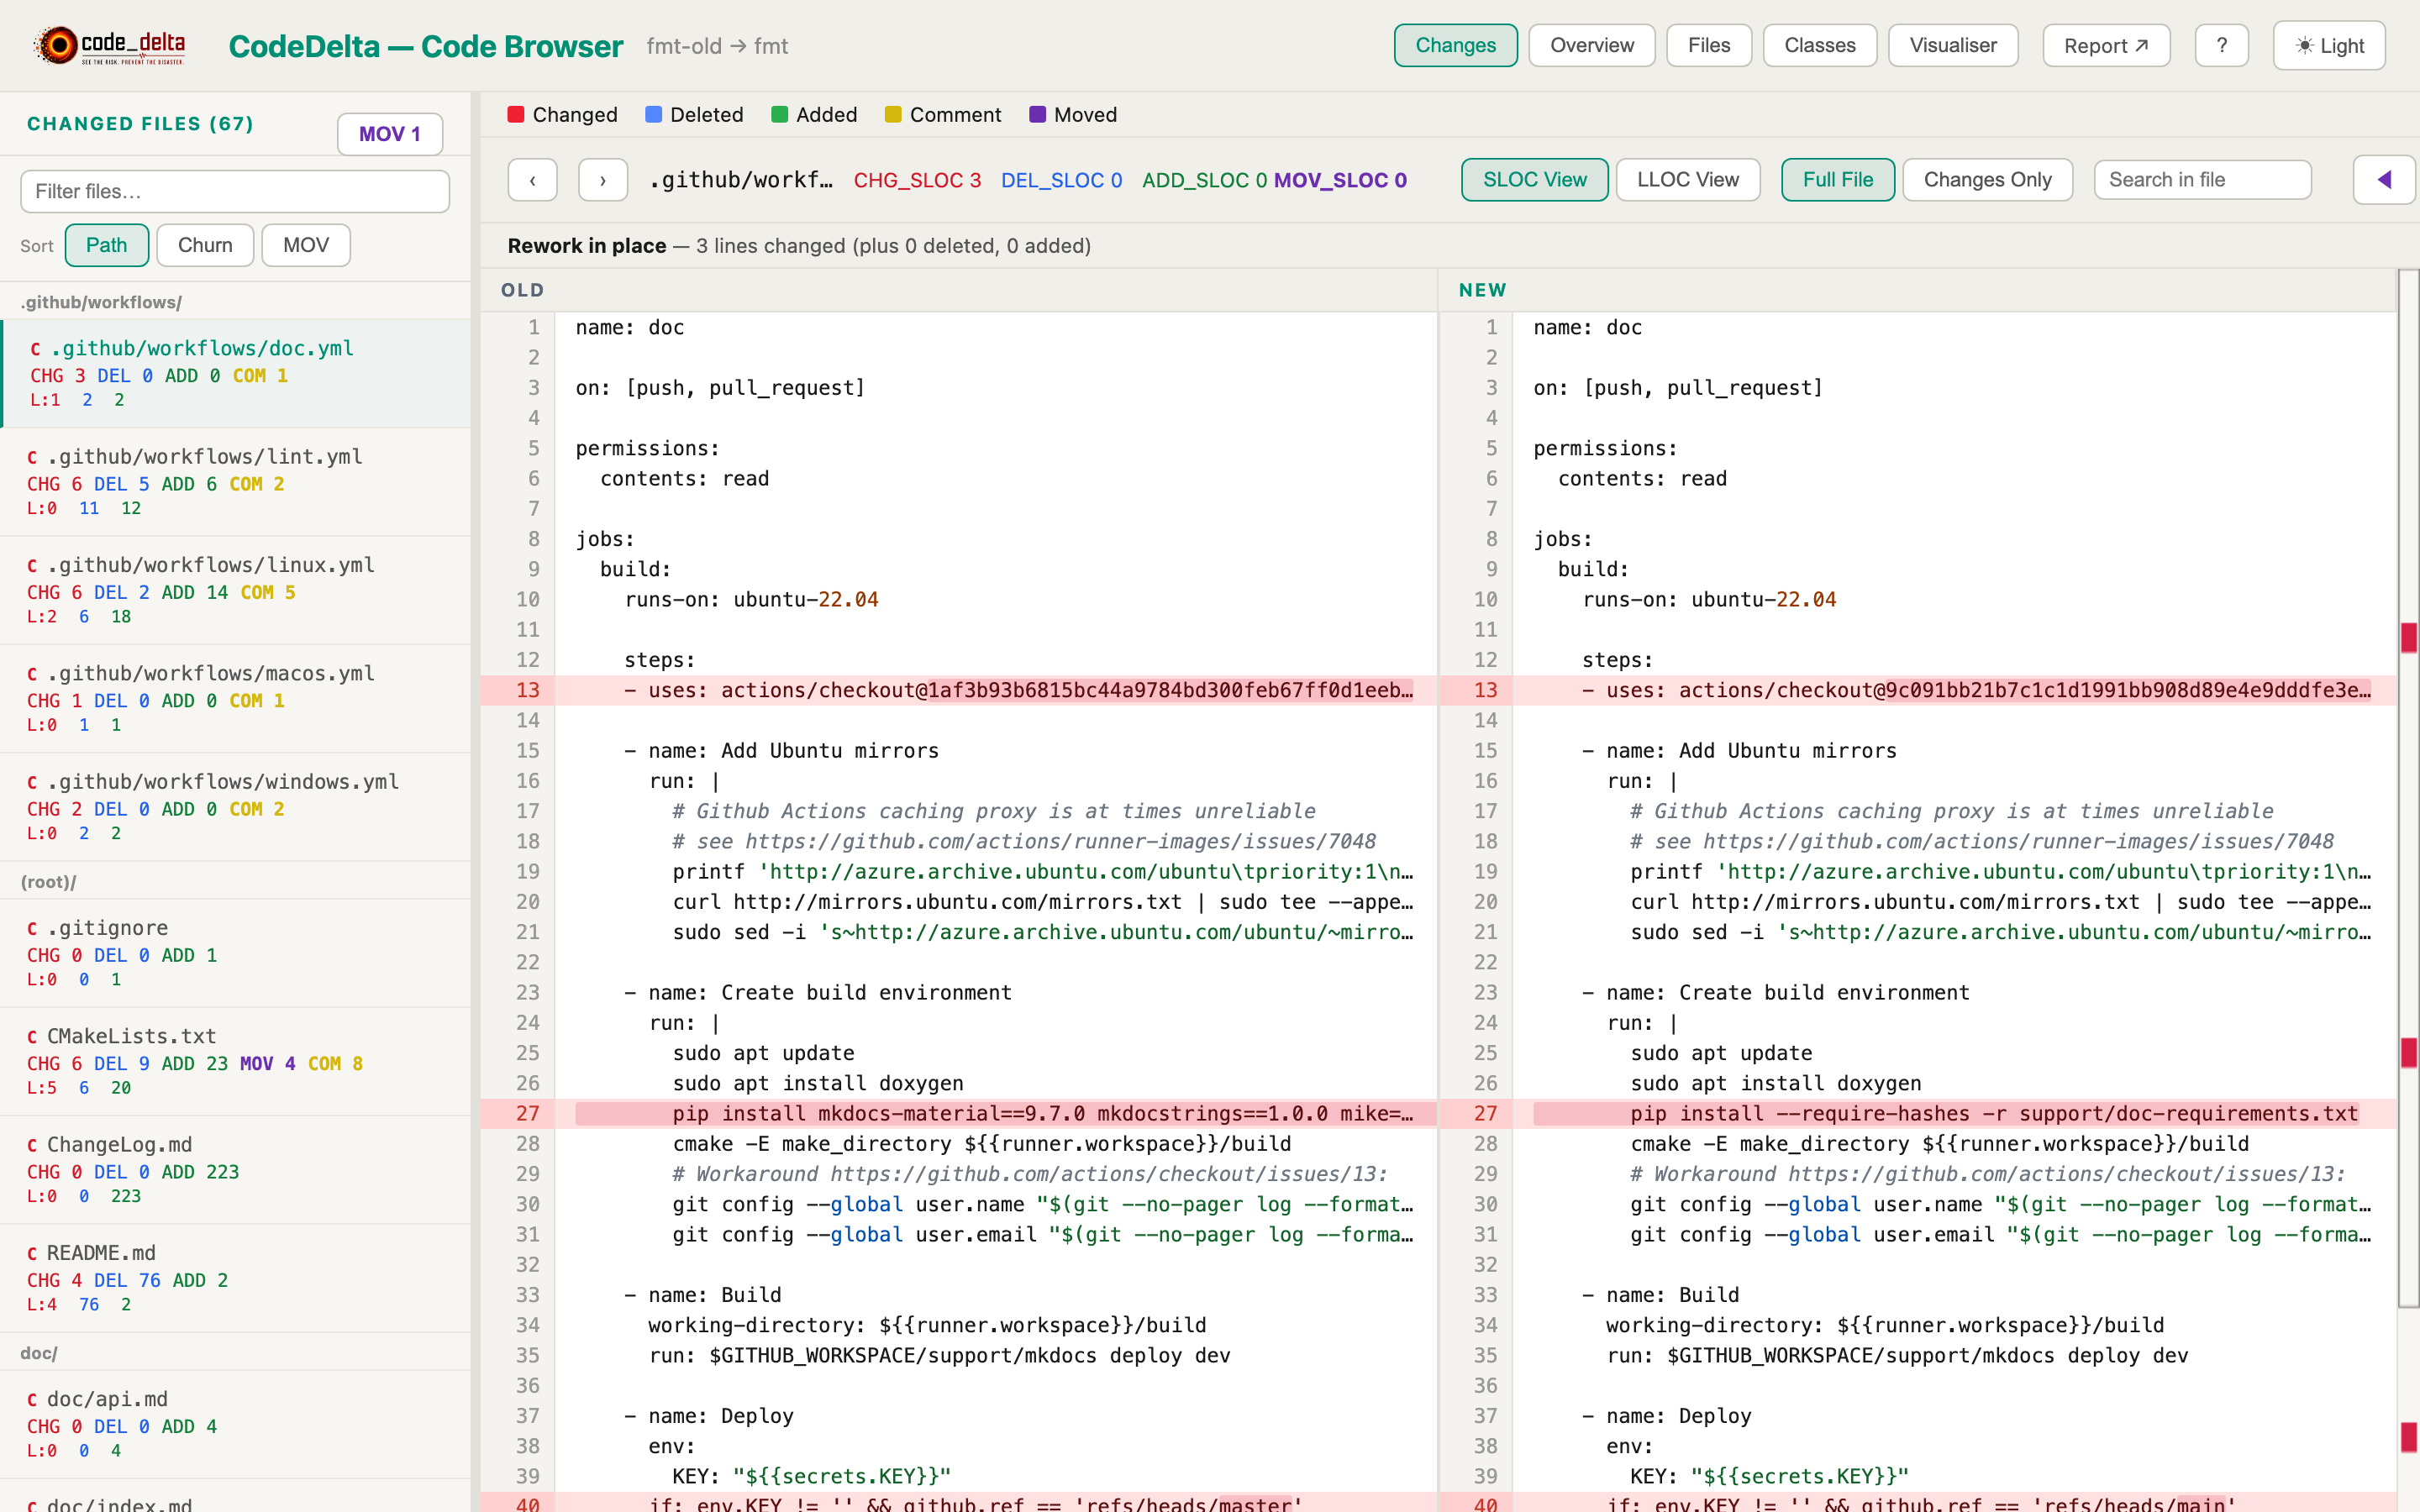
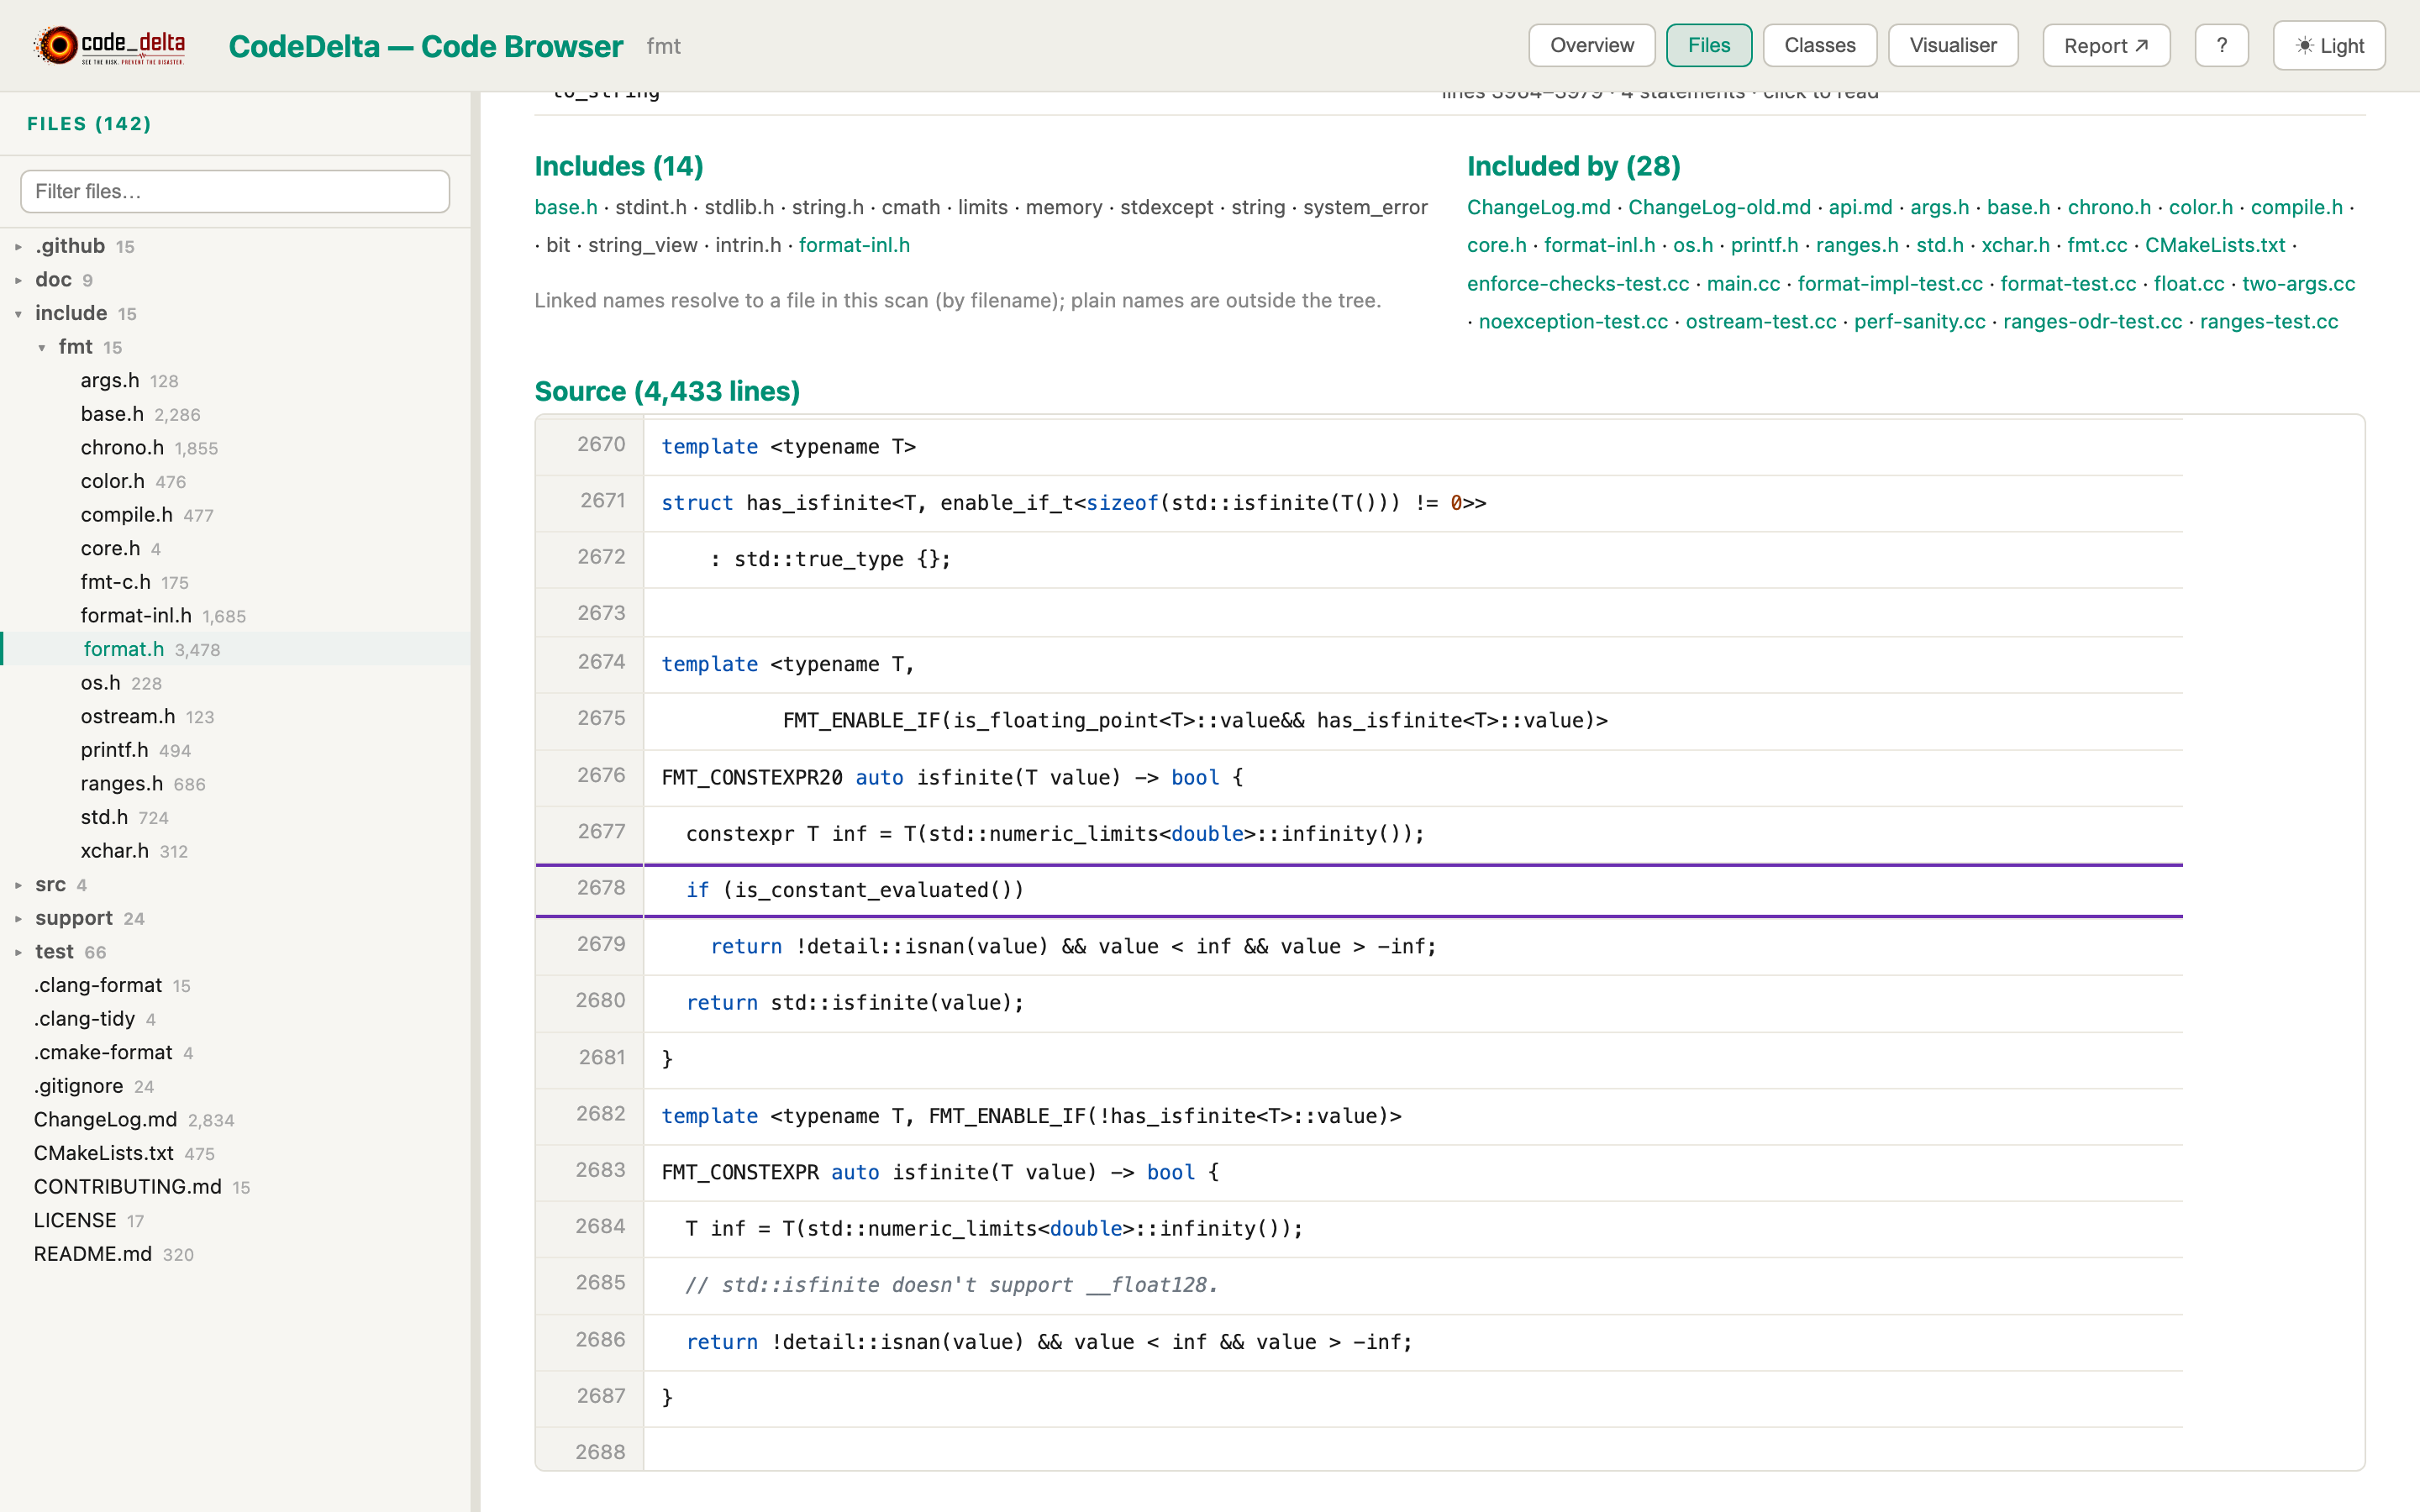
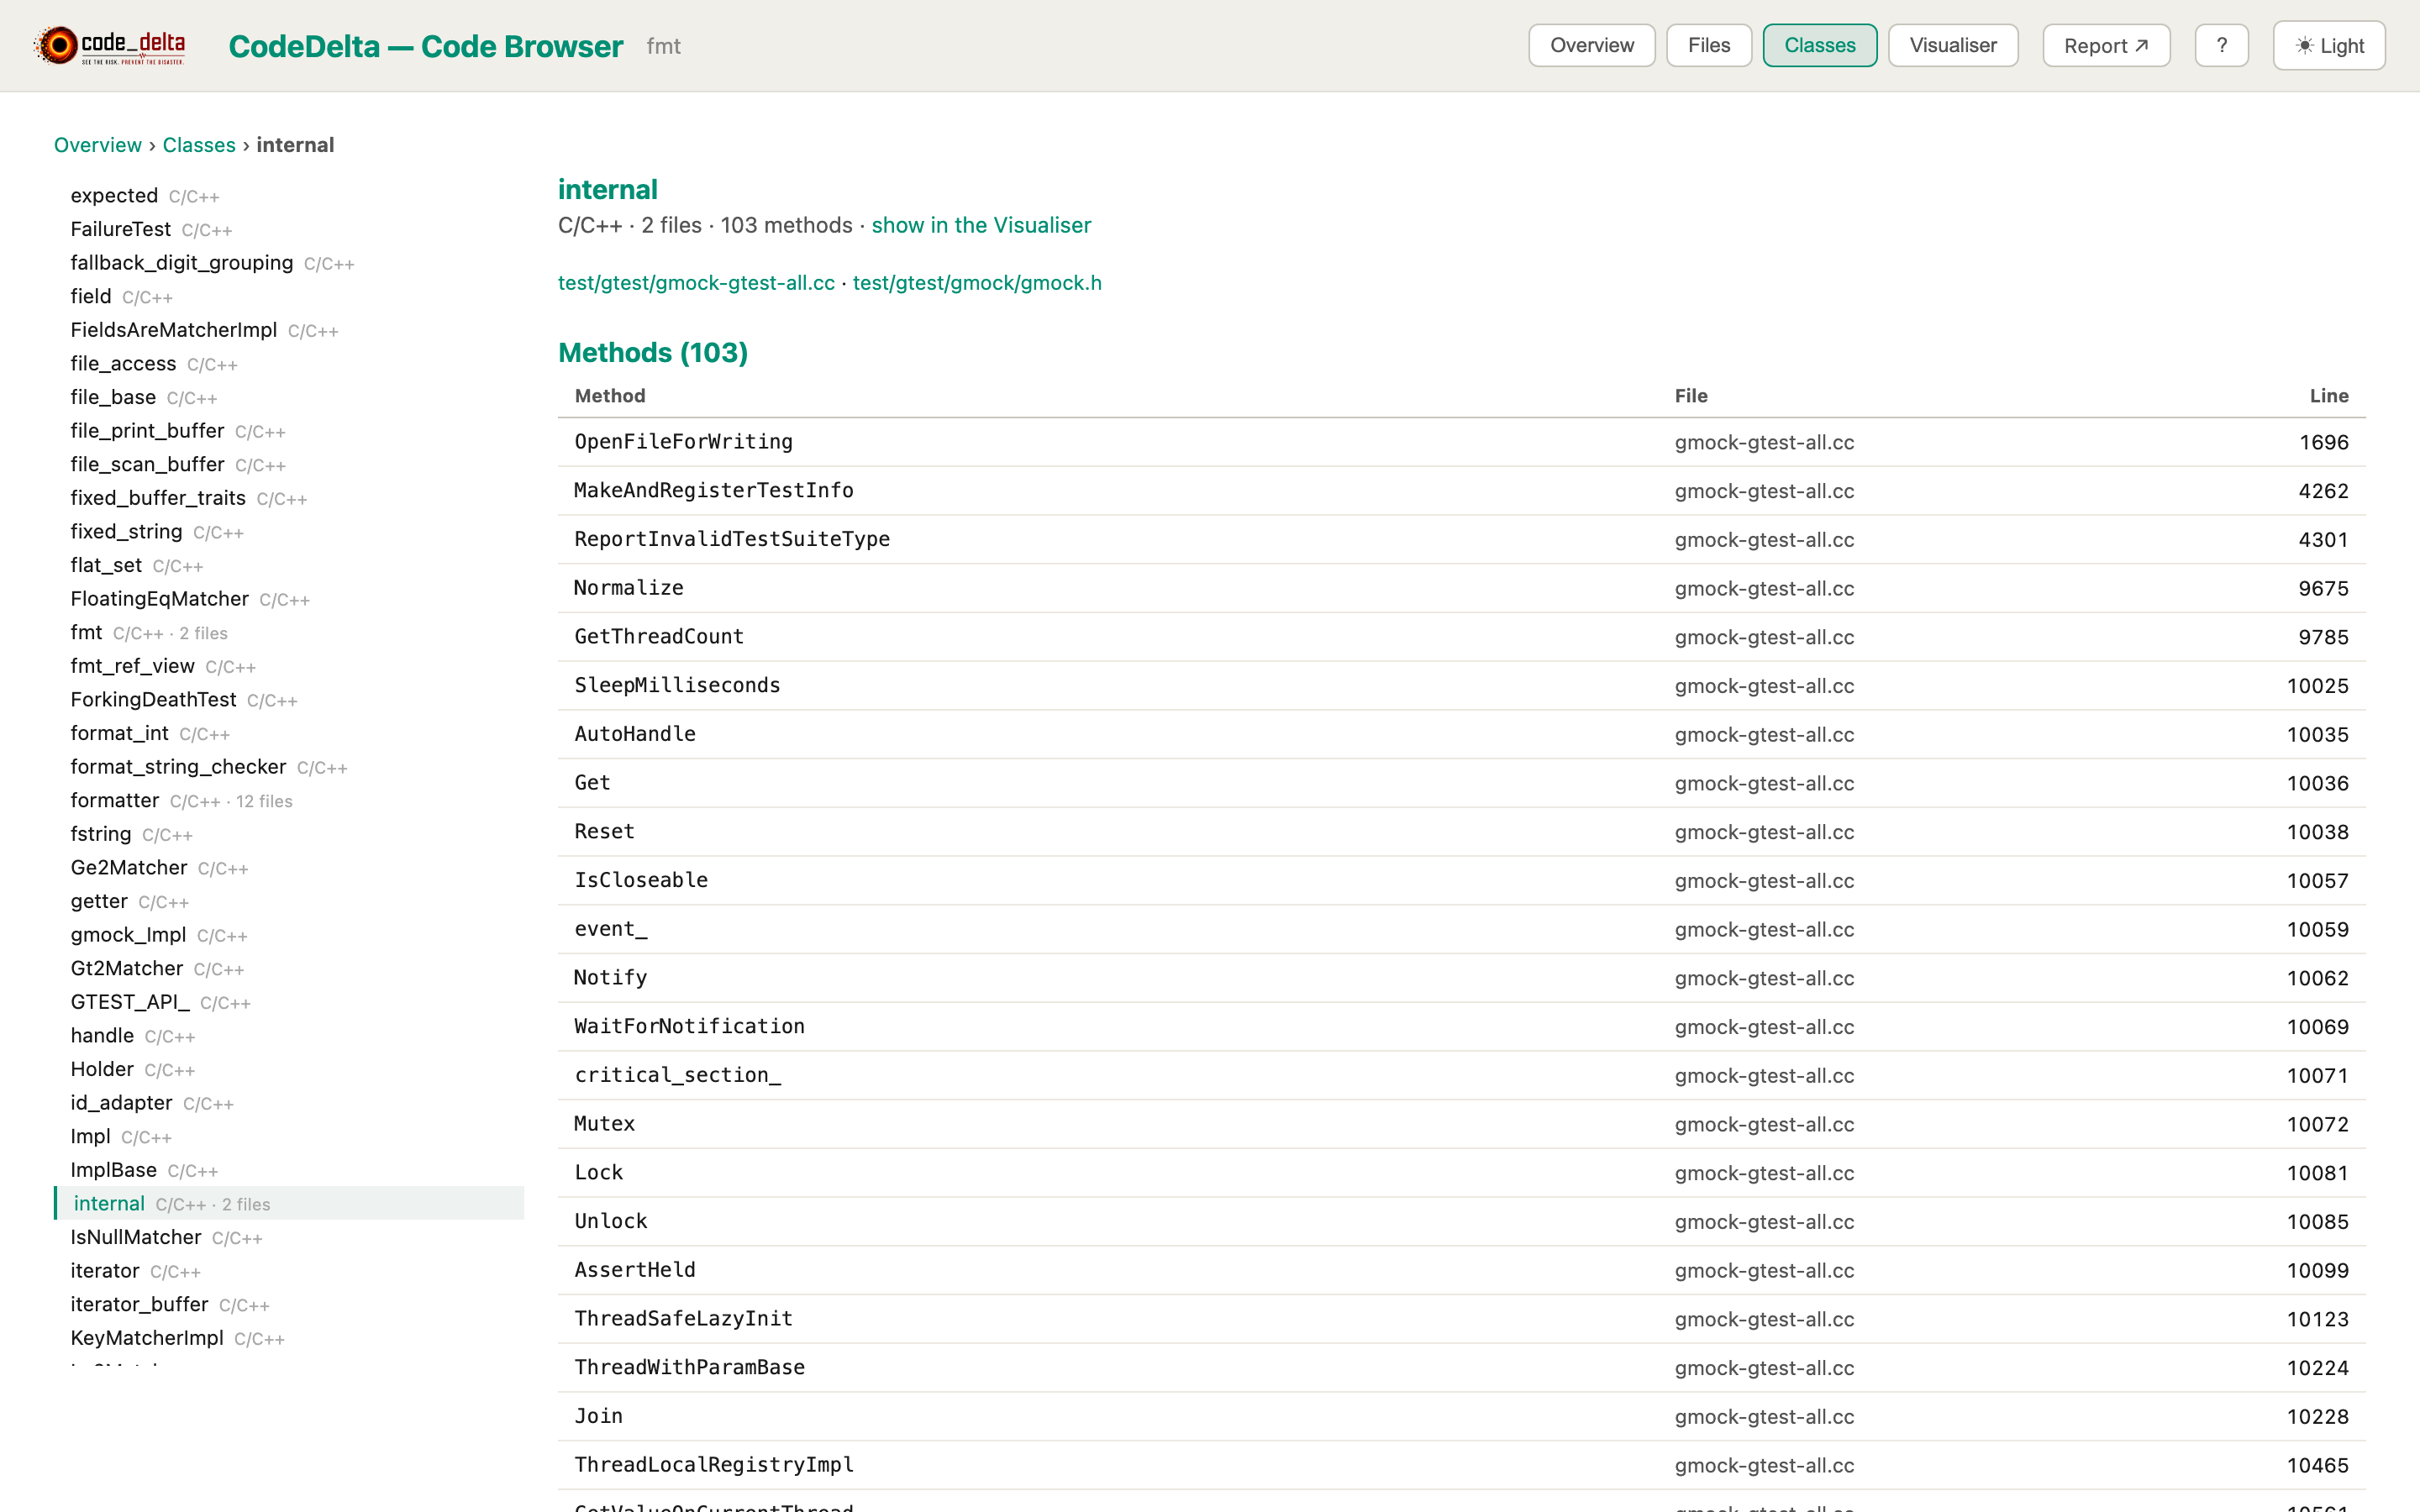
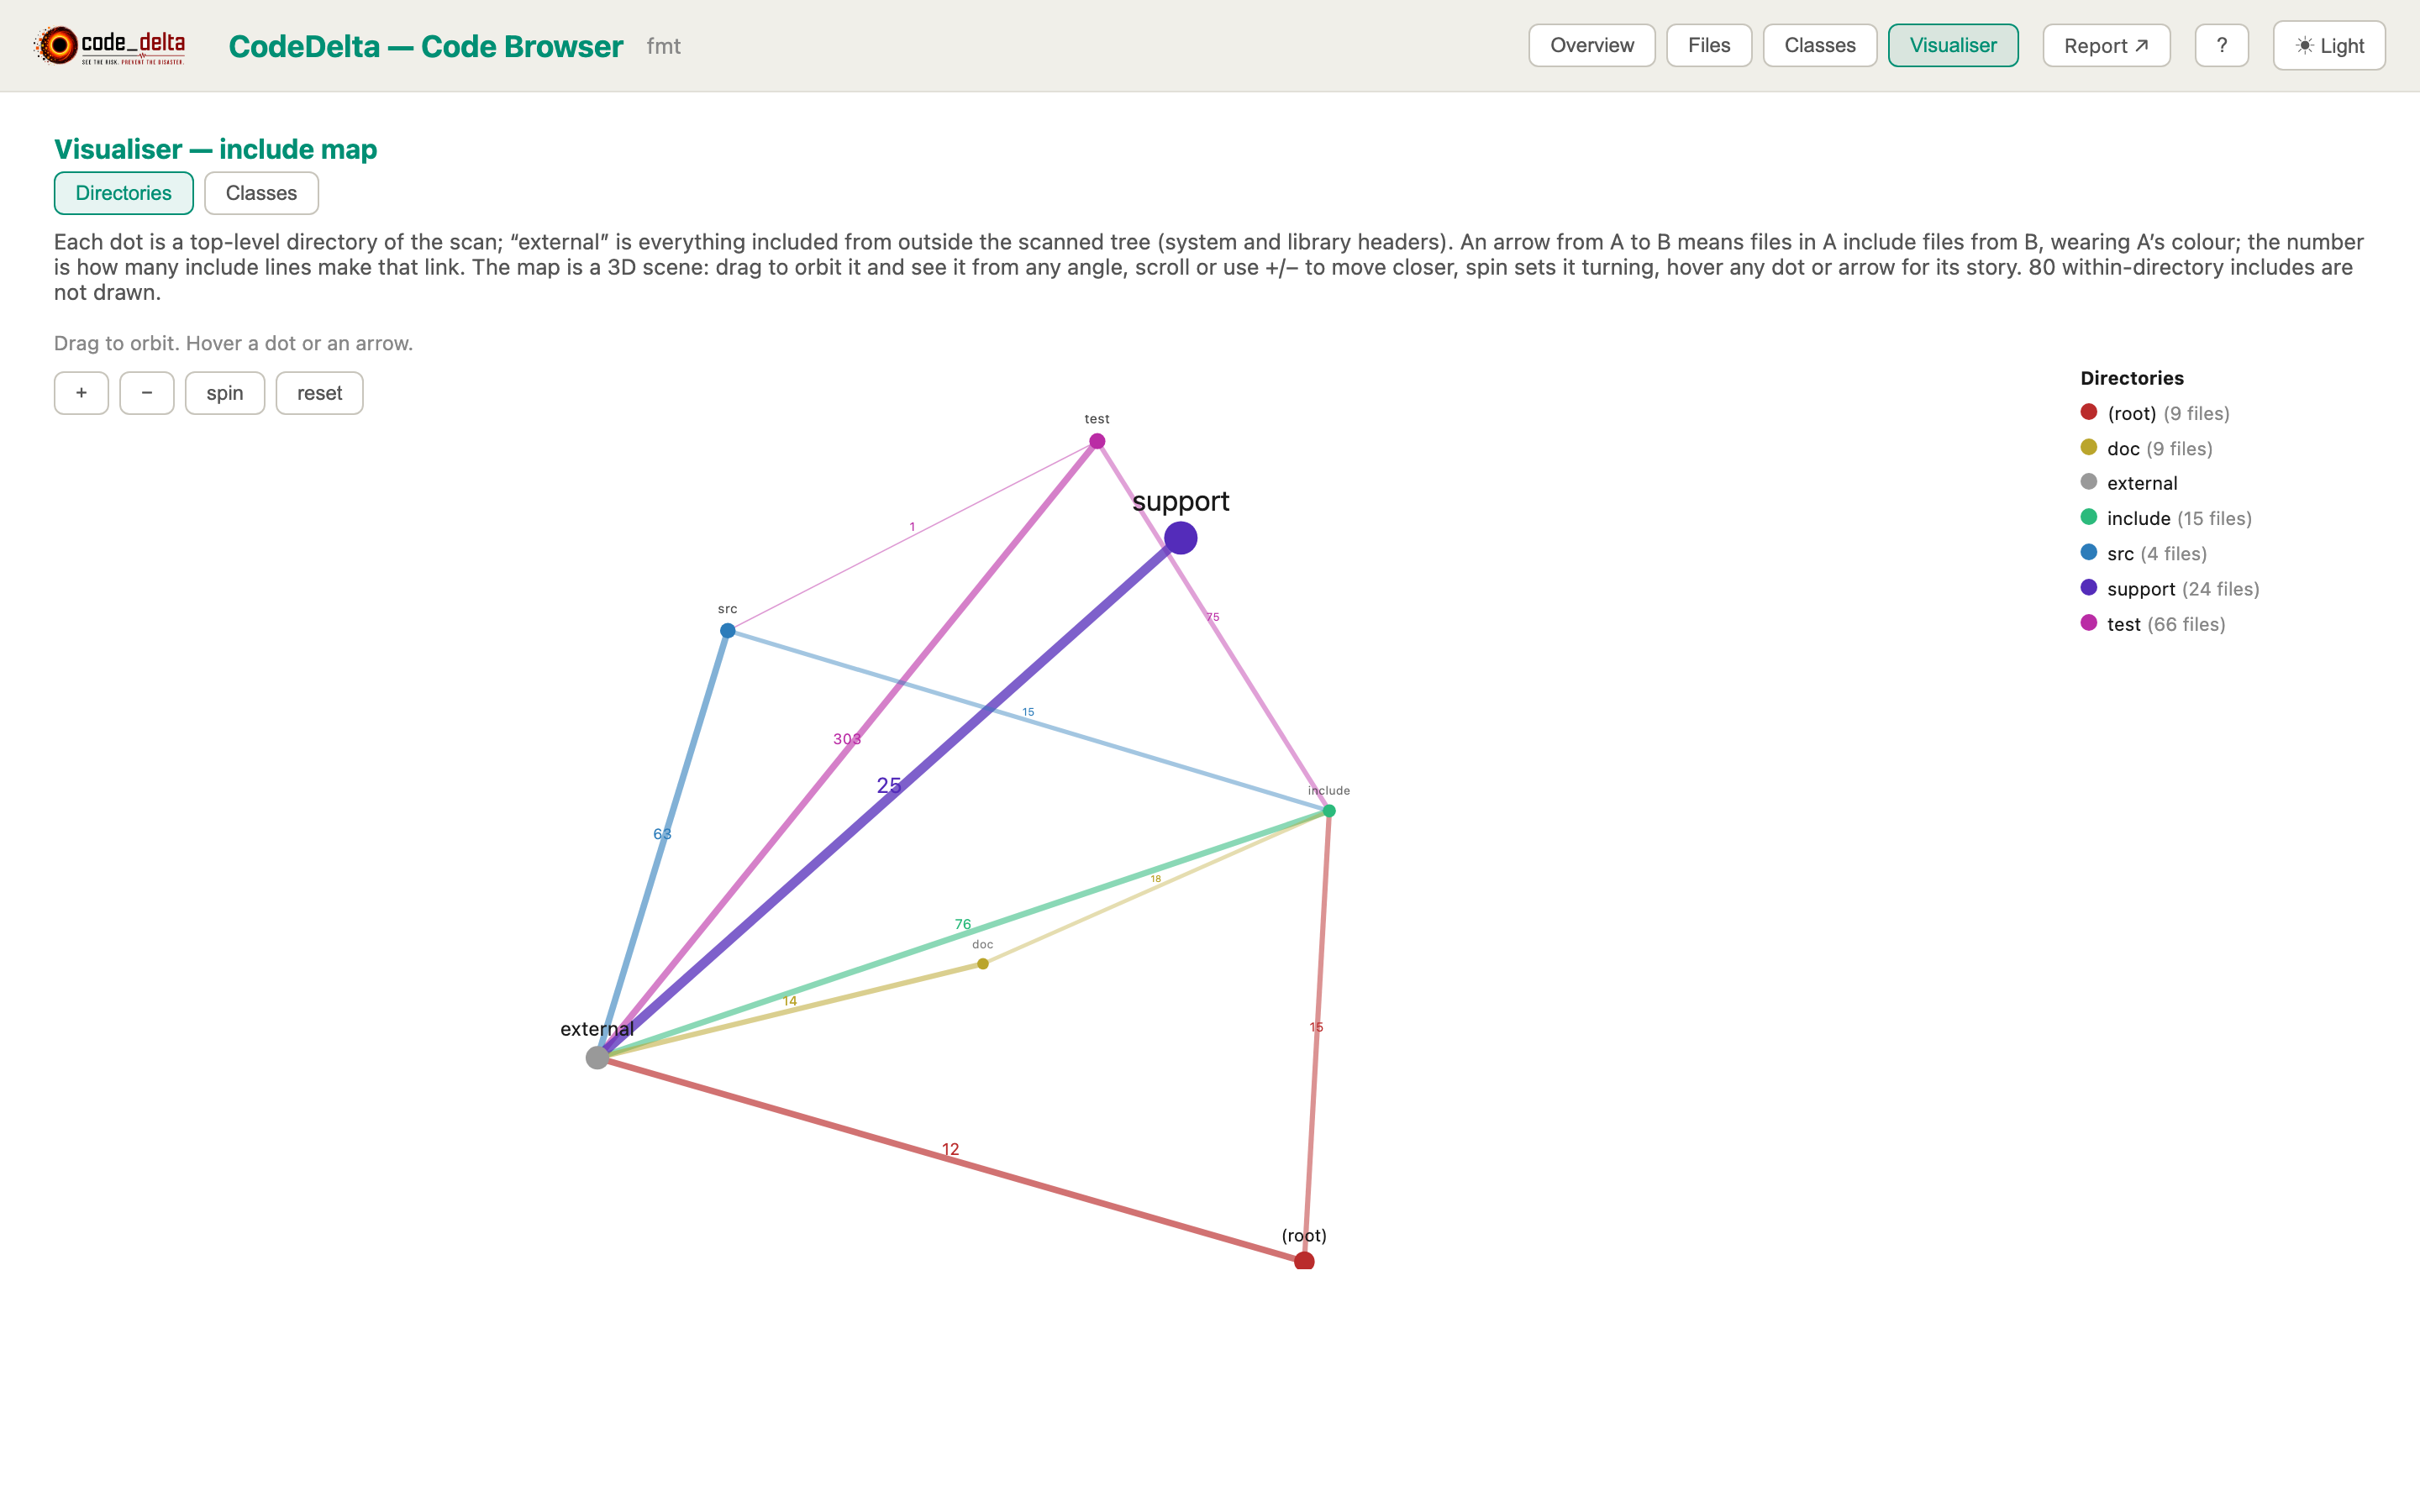
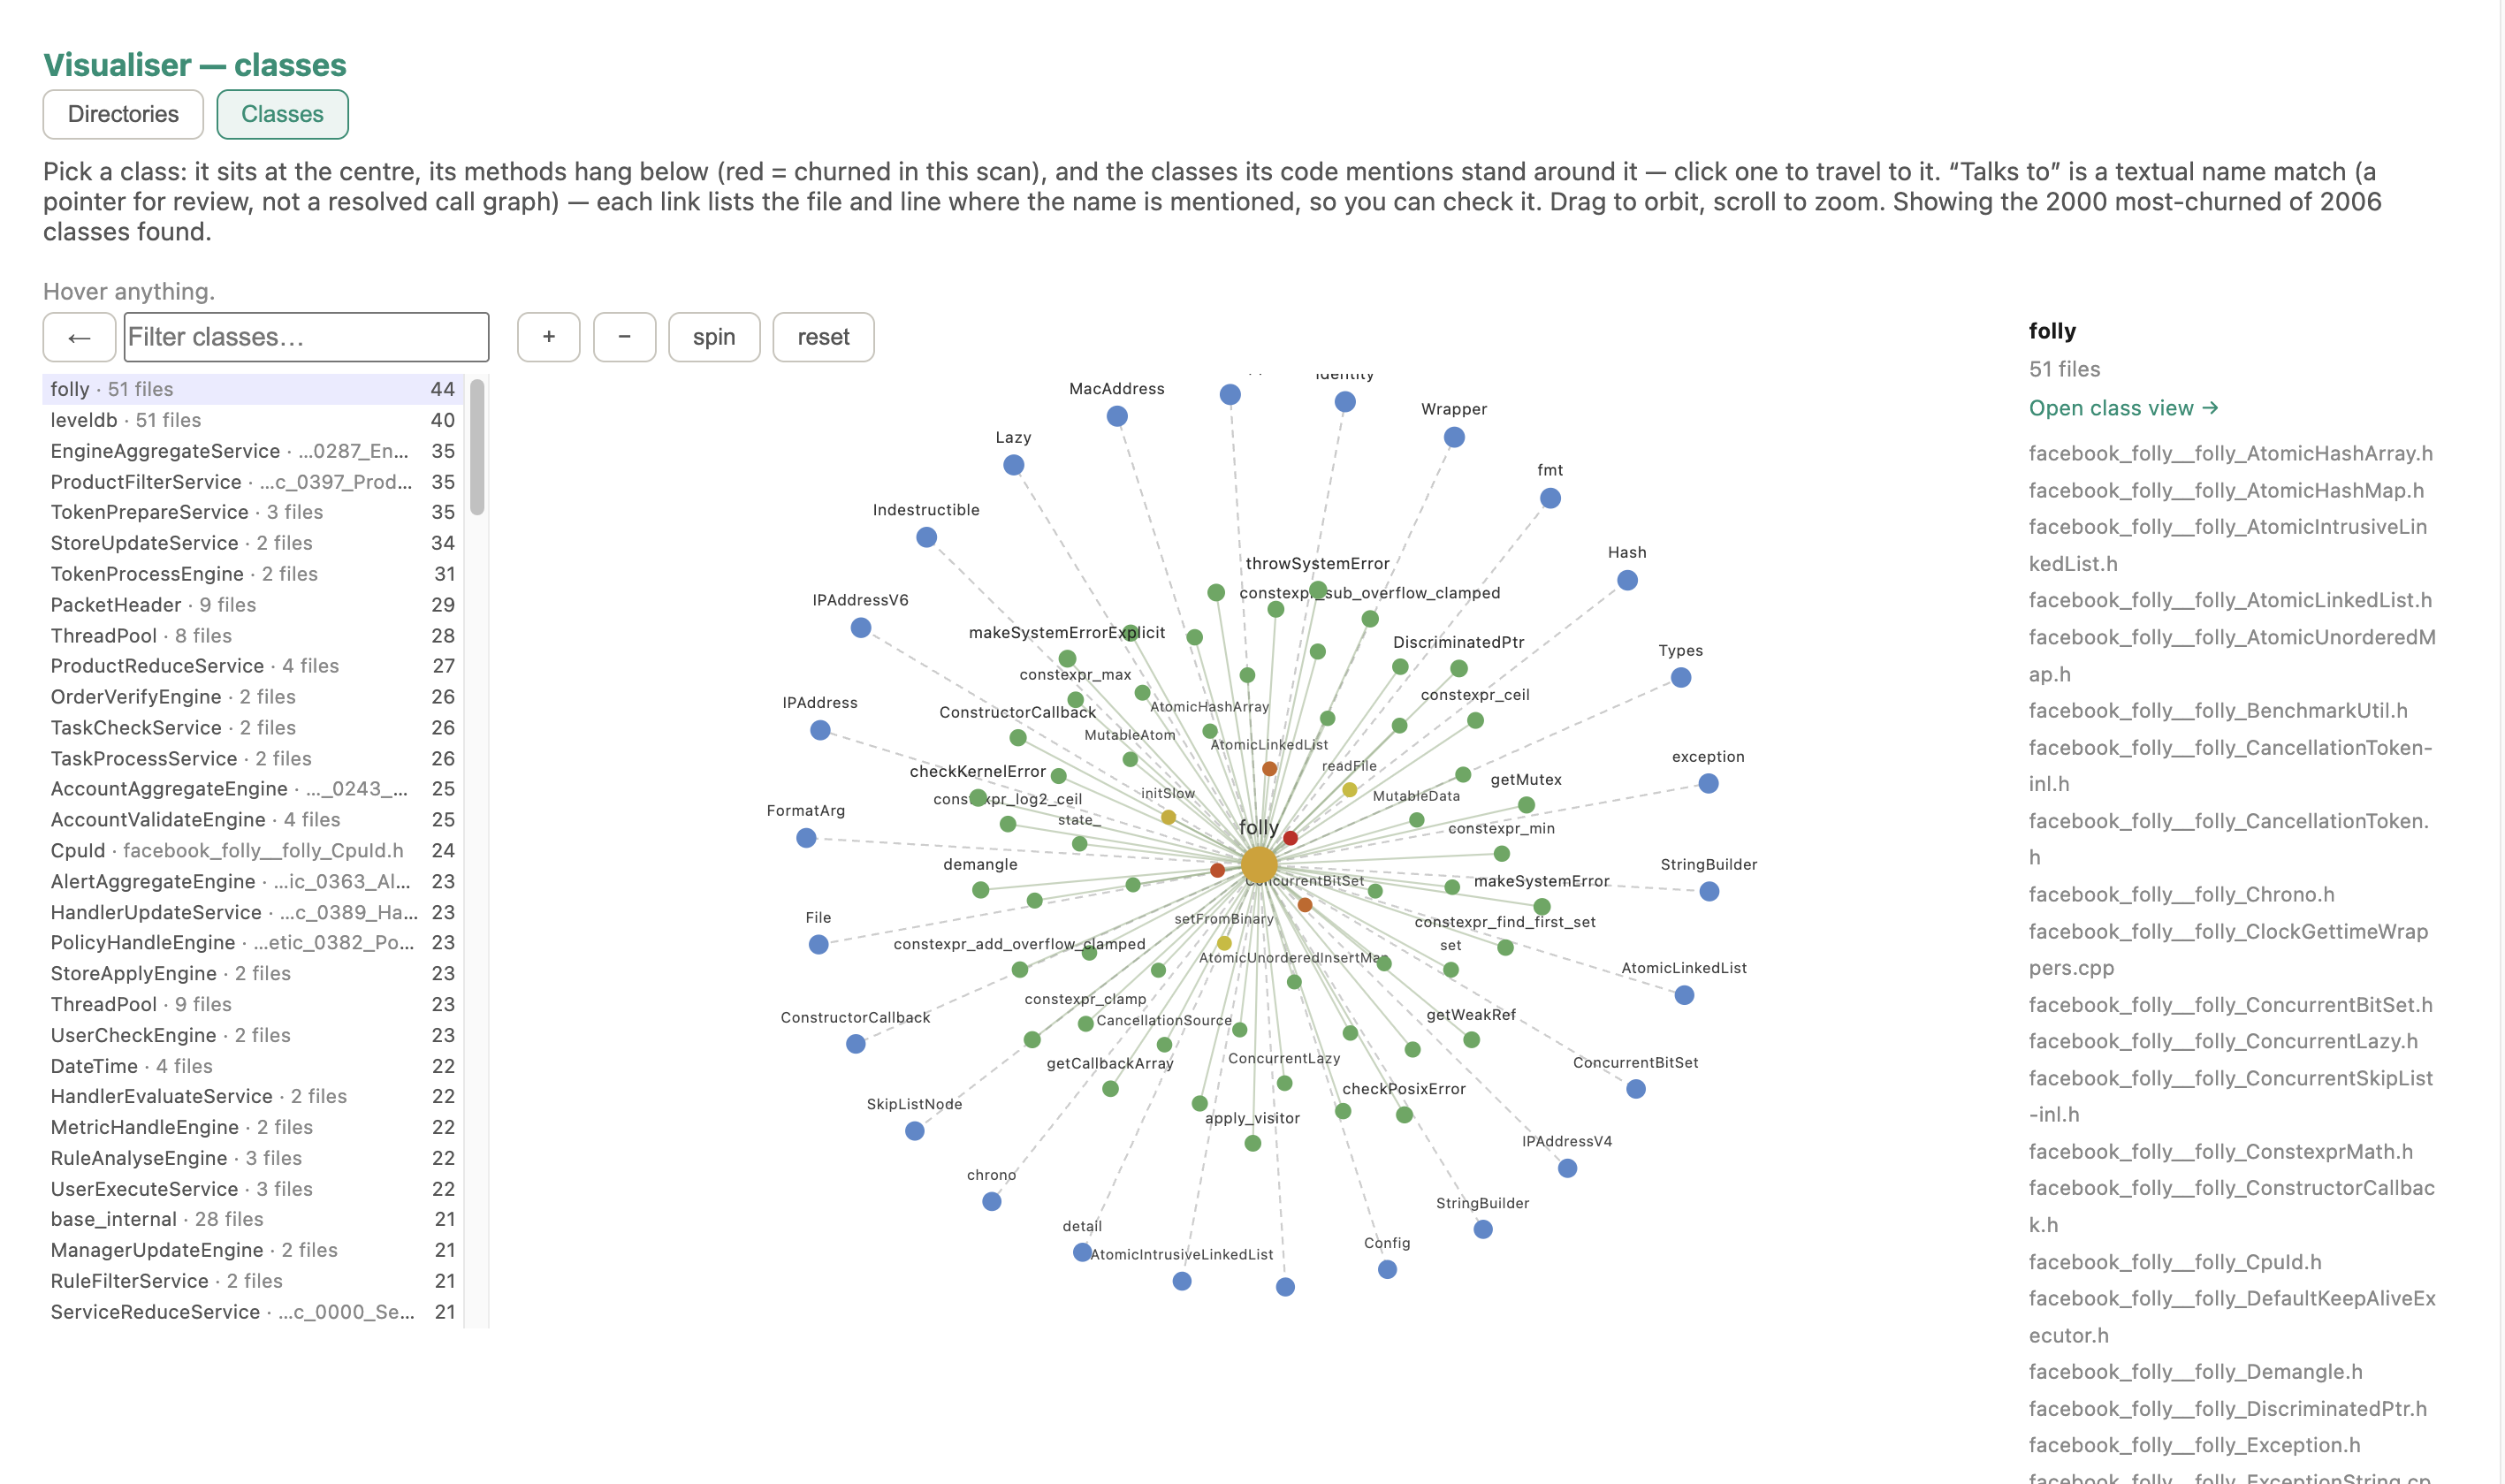
Read it in the guide: The Code Browser · the papers behind the counters: Papers.
Named SDK calls, model endpoints, exec-on-model-output, raw API keys, non-Western providers — found by reading the code, never by running it. Every flag names the file and line; the Agent Map draws the AI bill of materials as a picture. Agent Scan now has its own page: coverage, detections and the evidence.
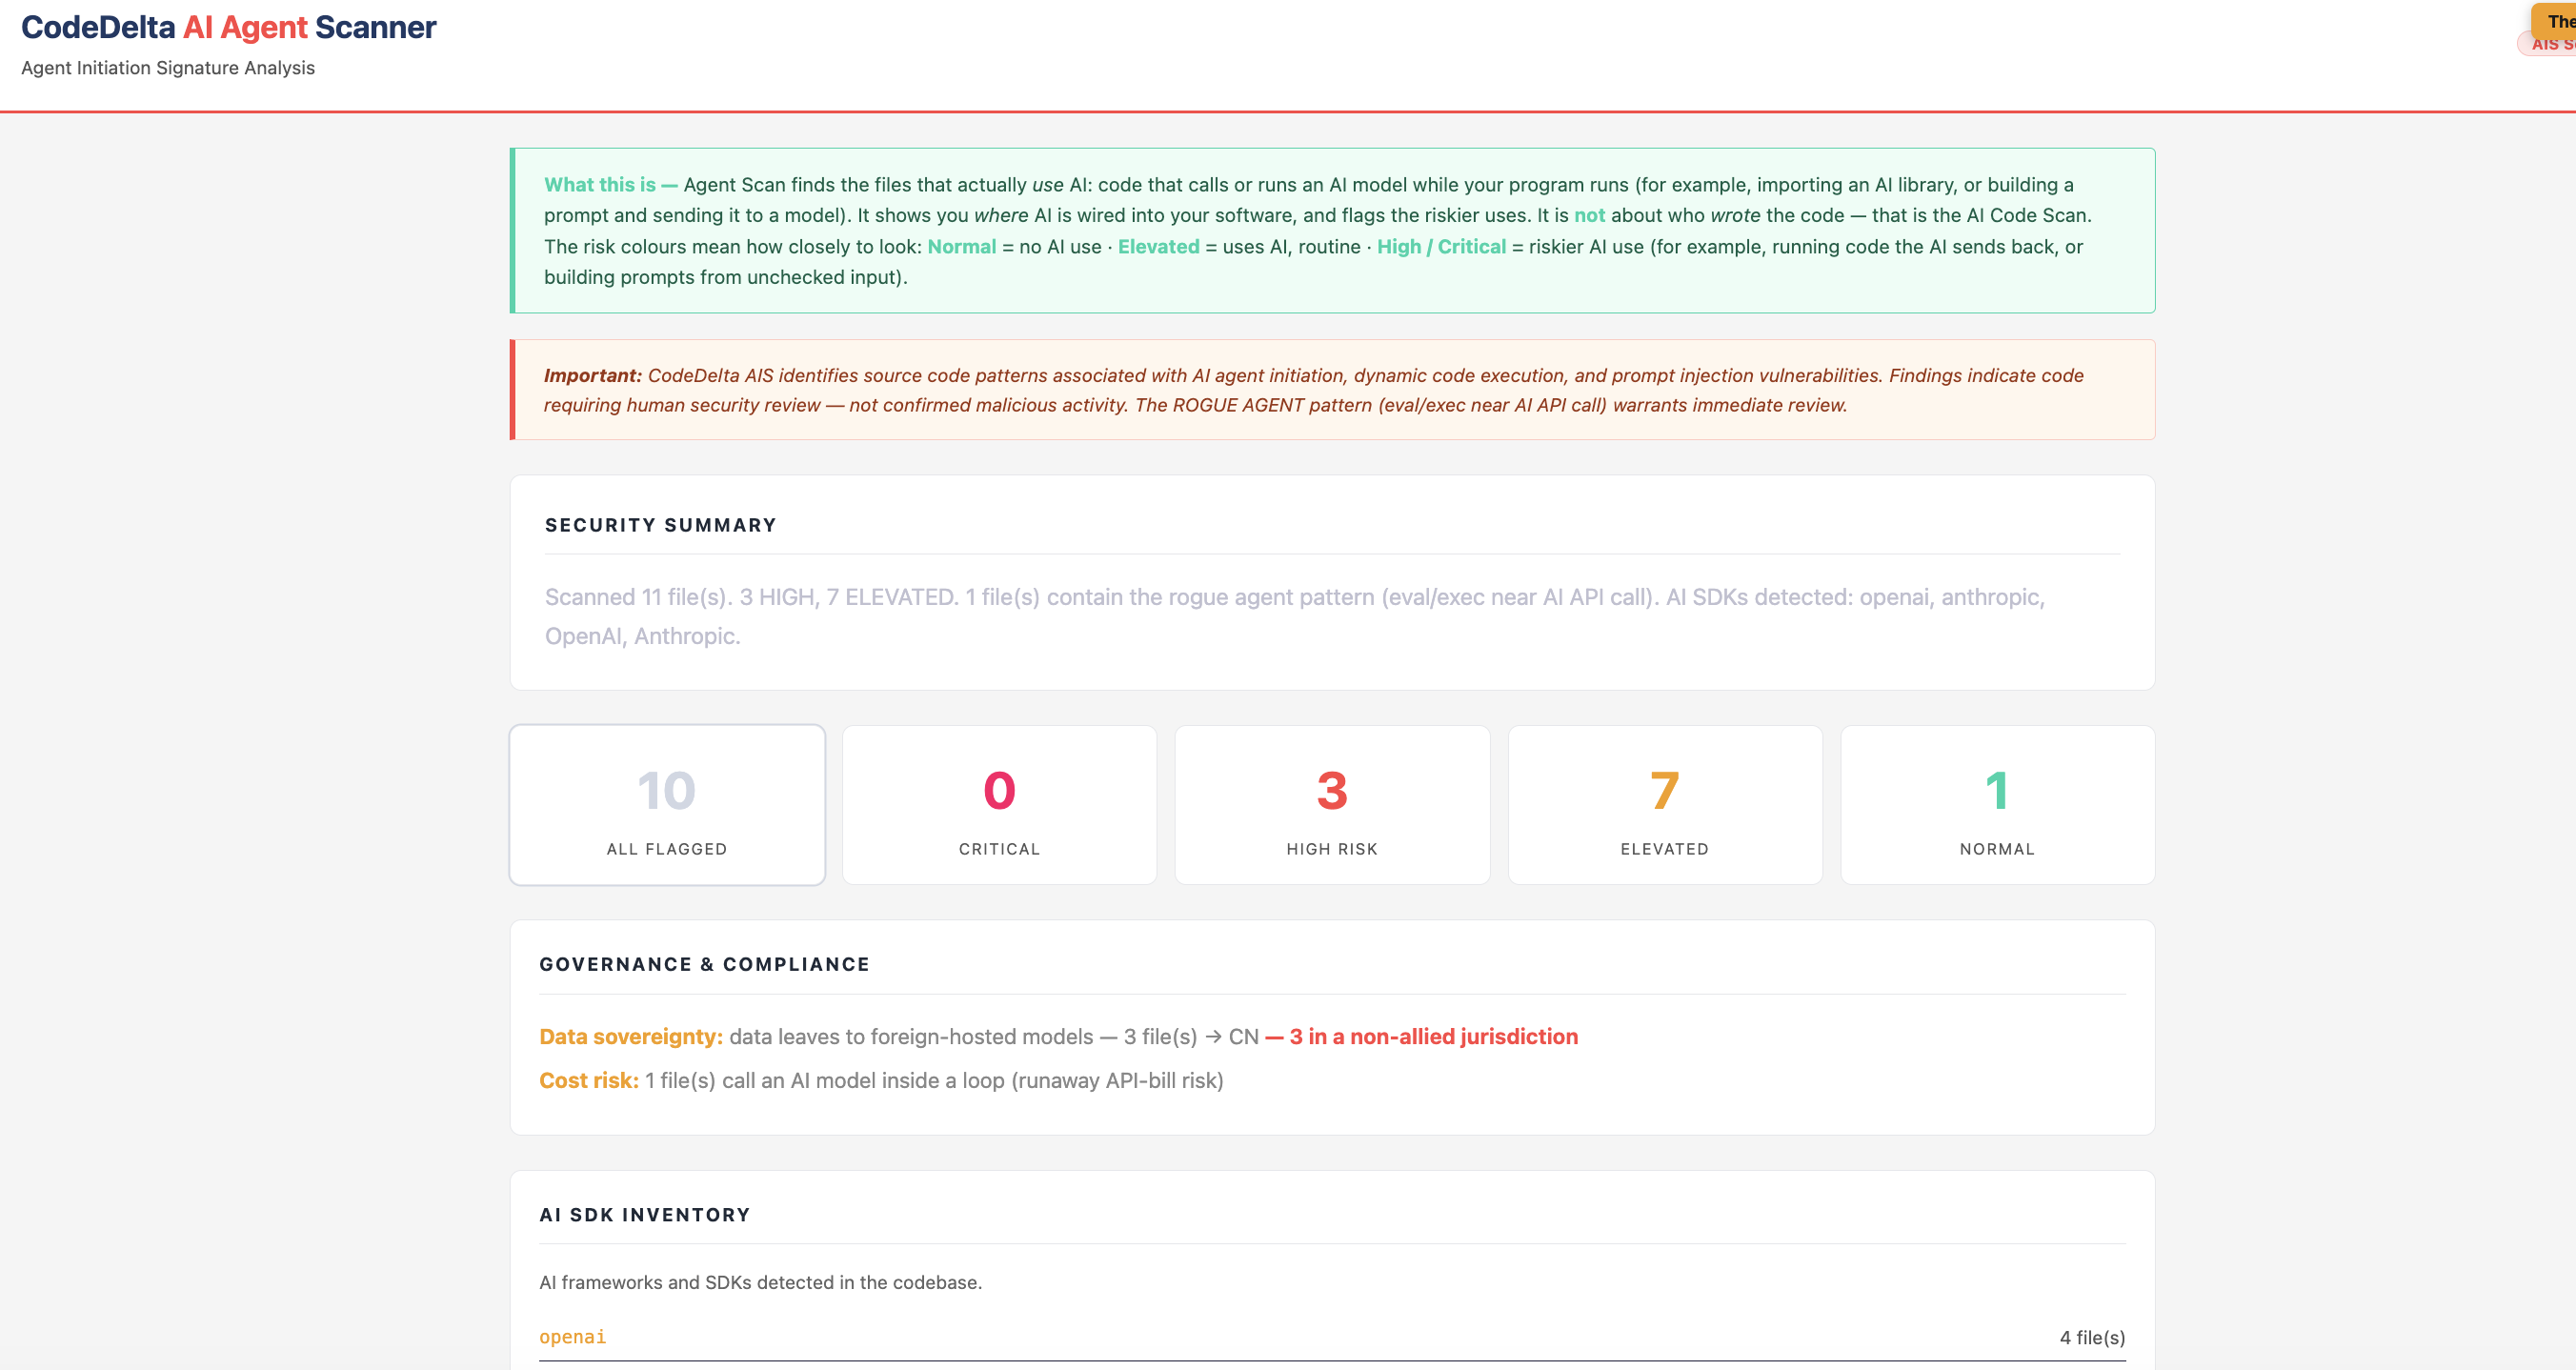
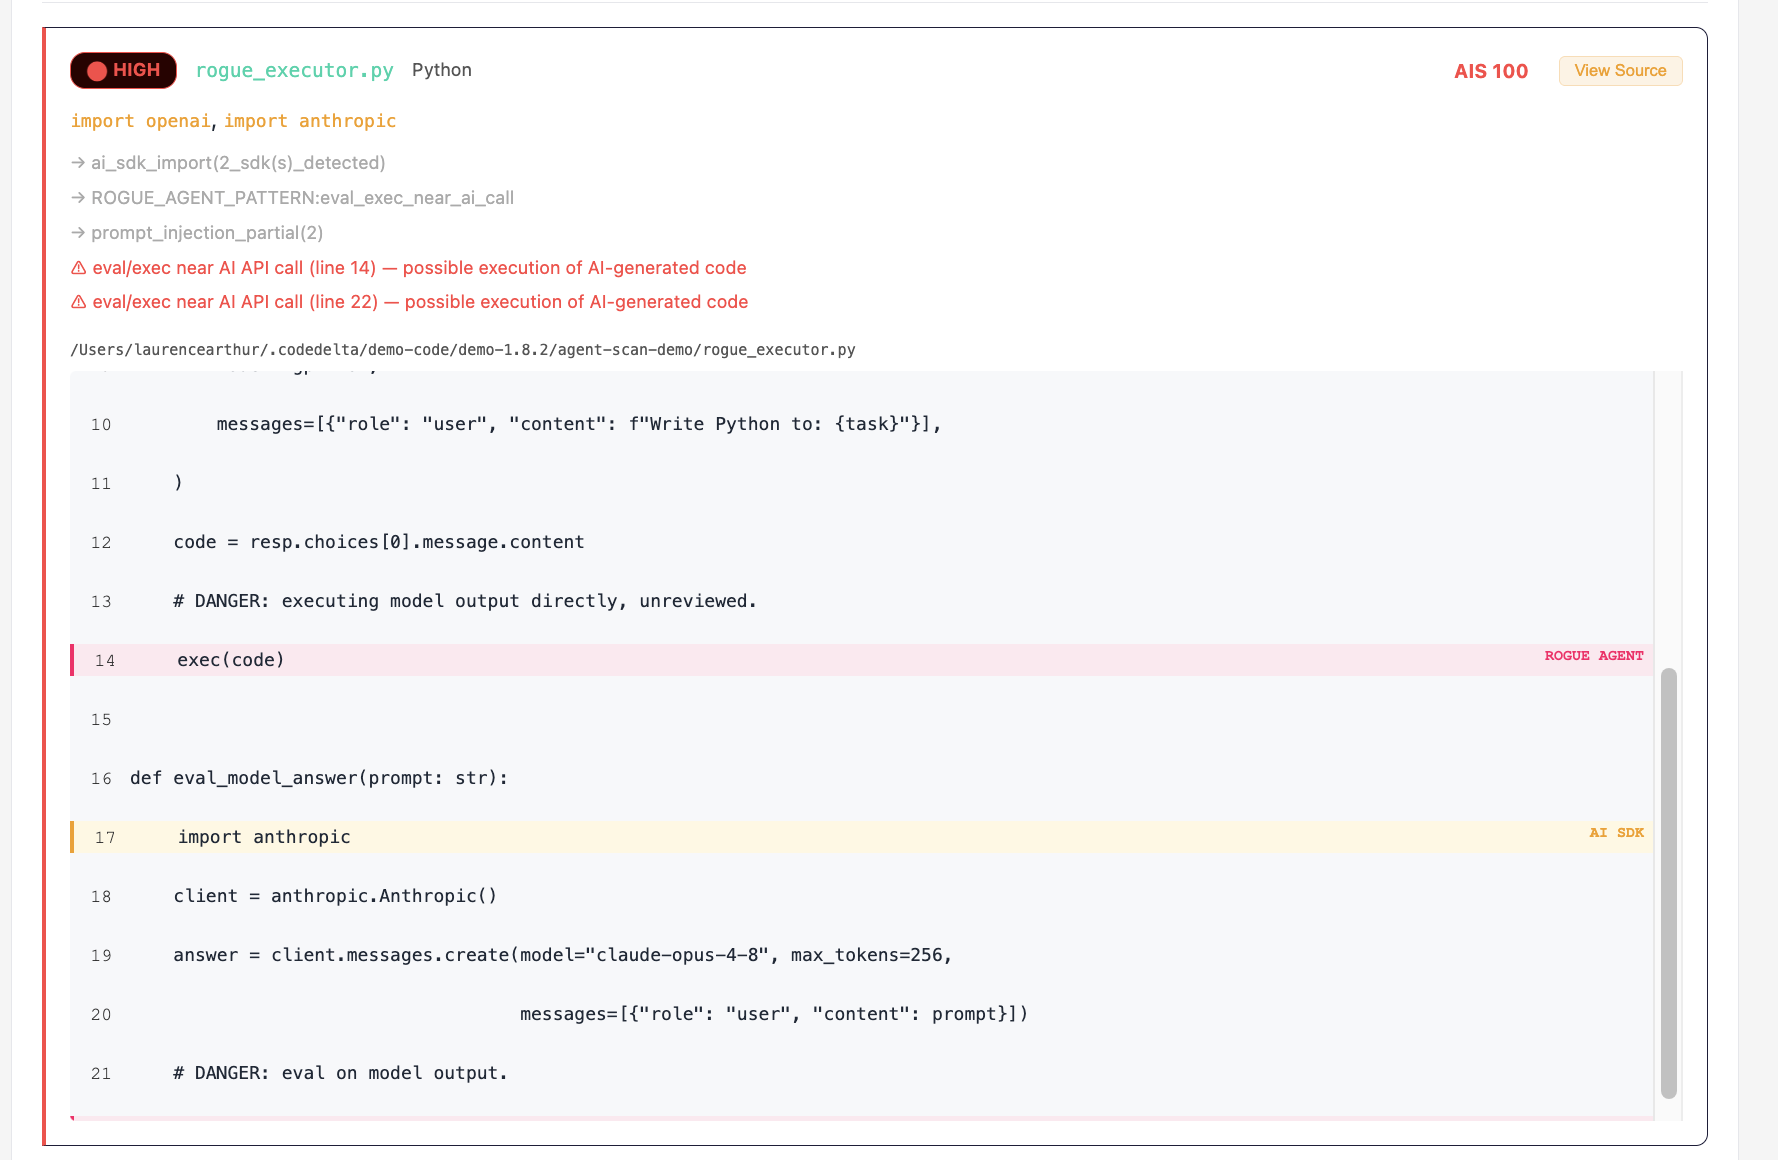
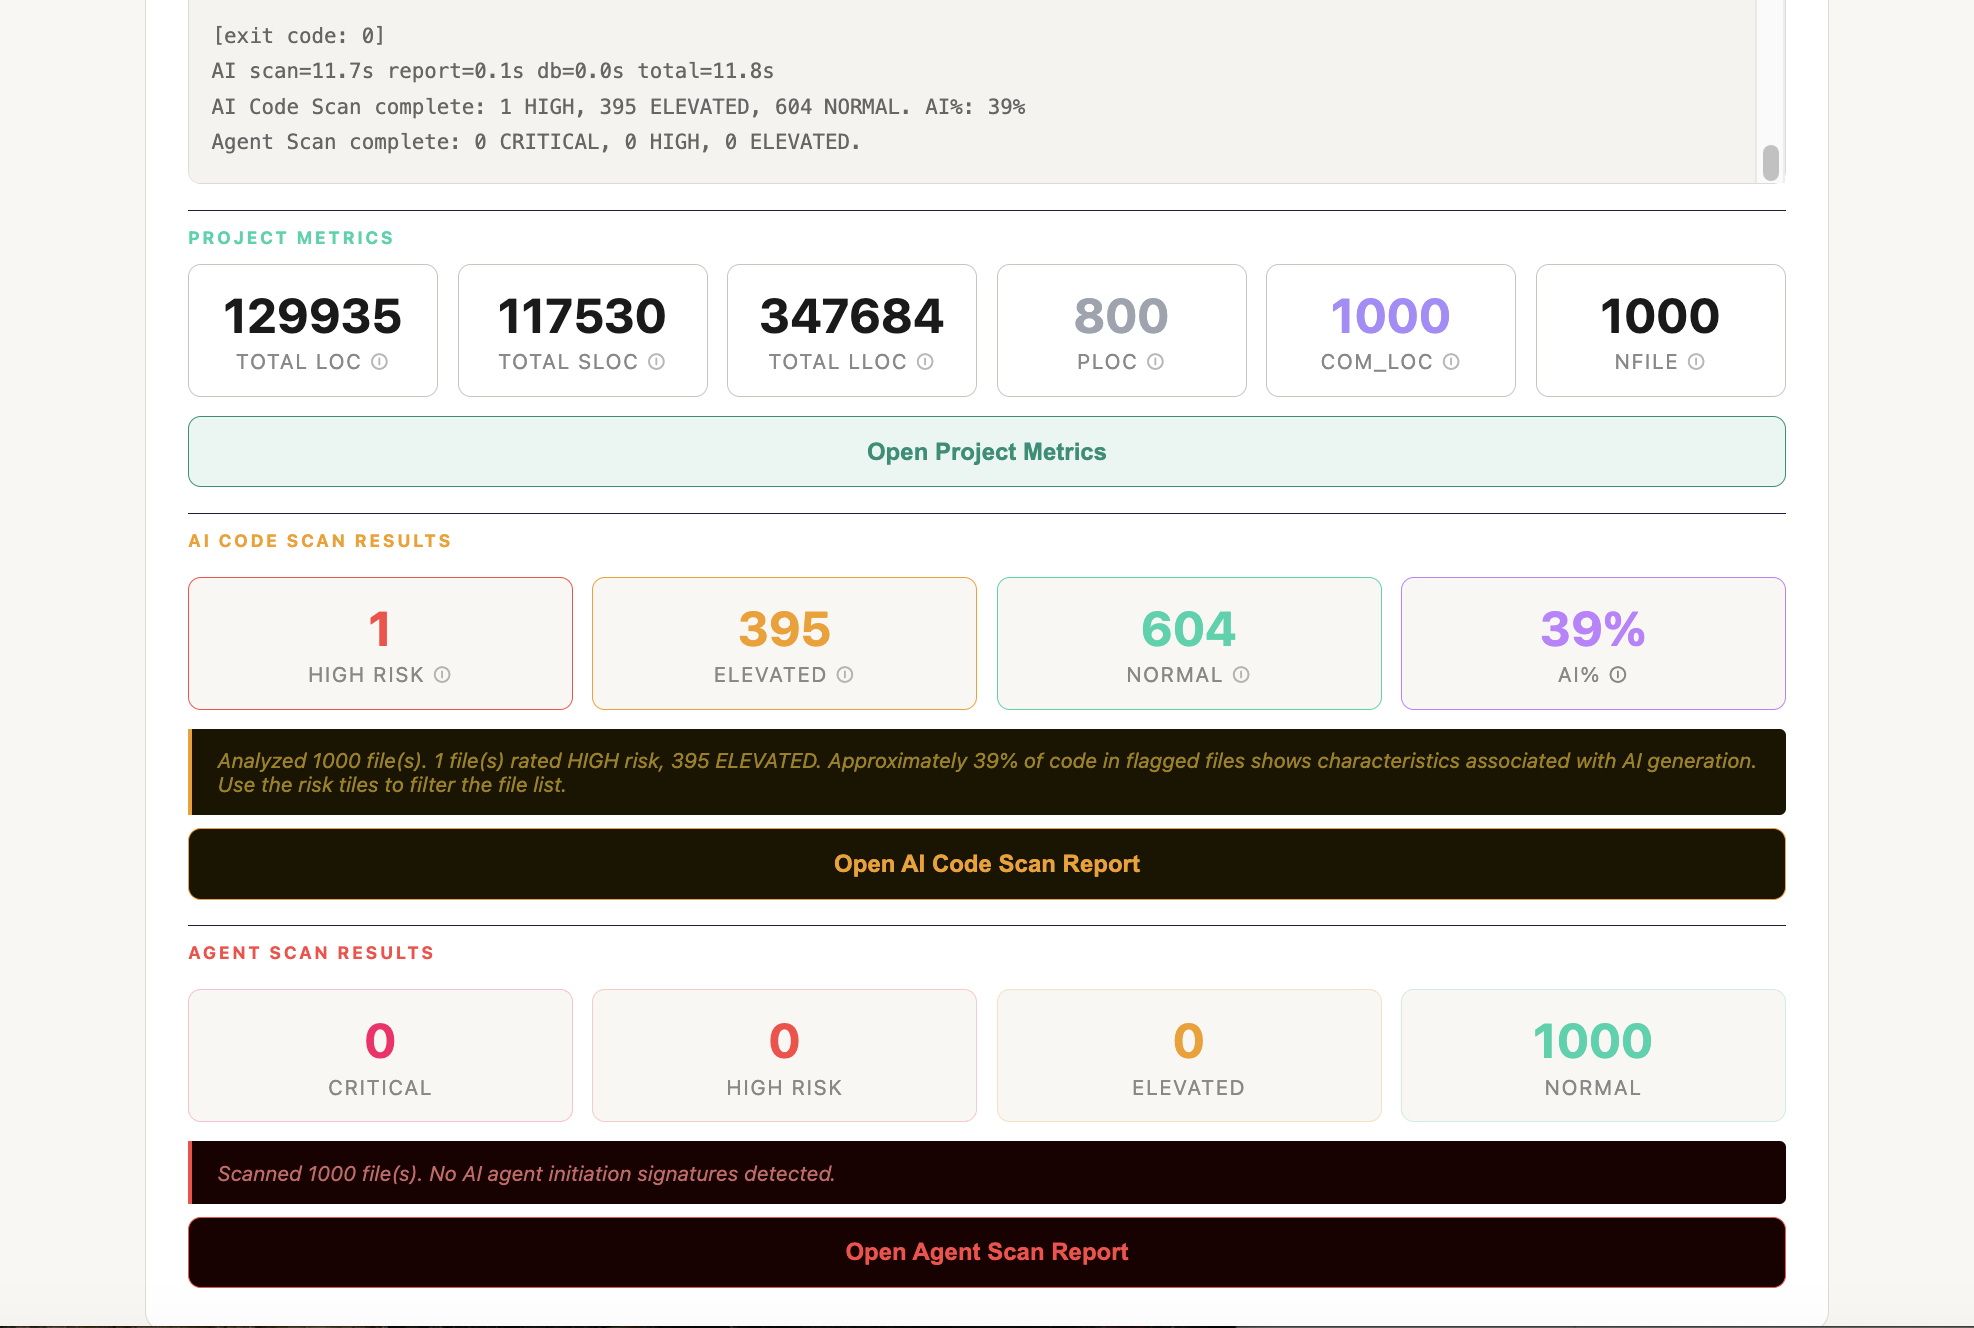
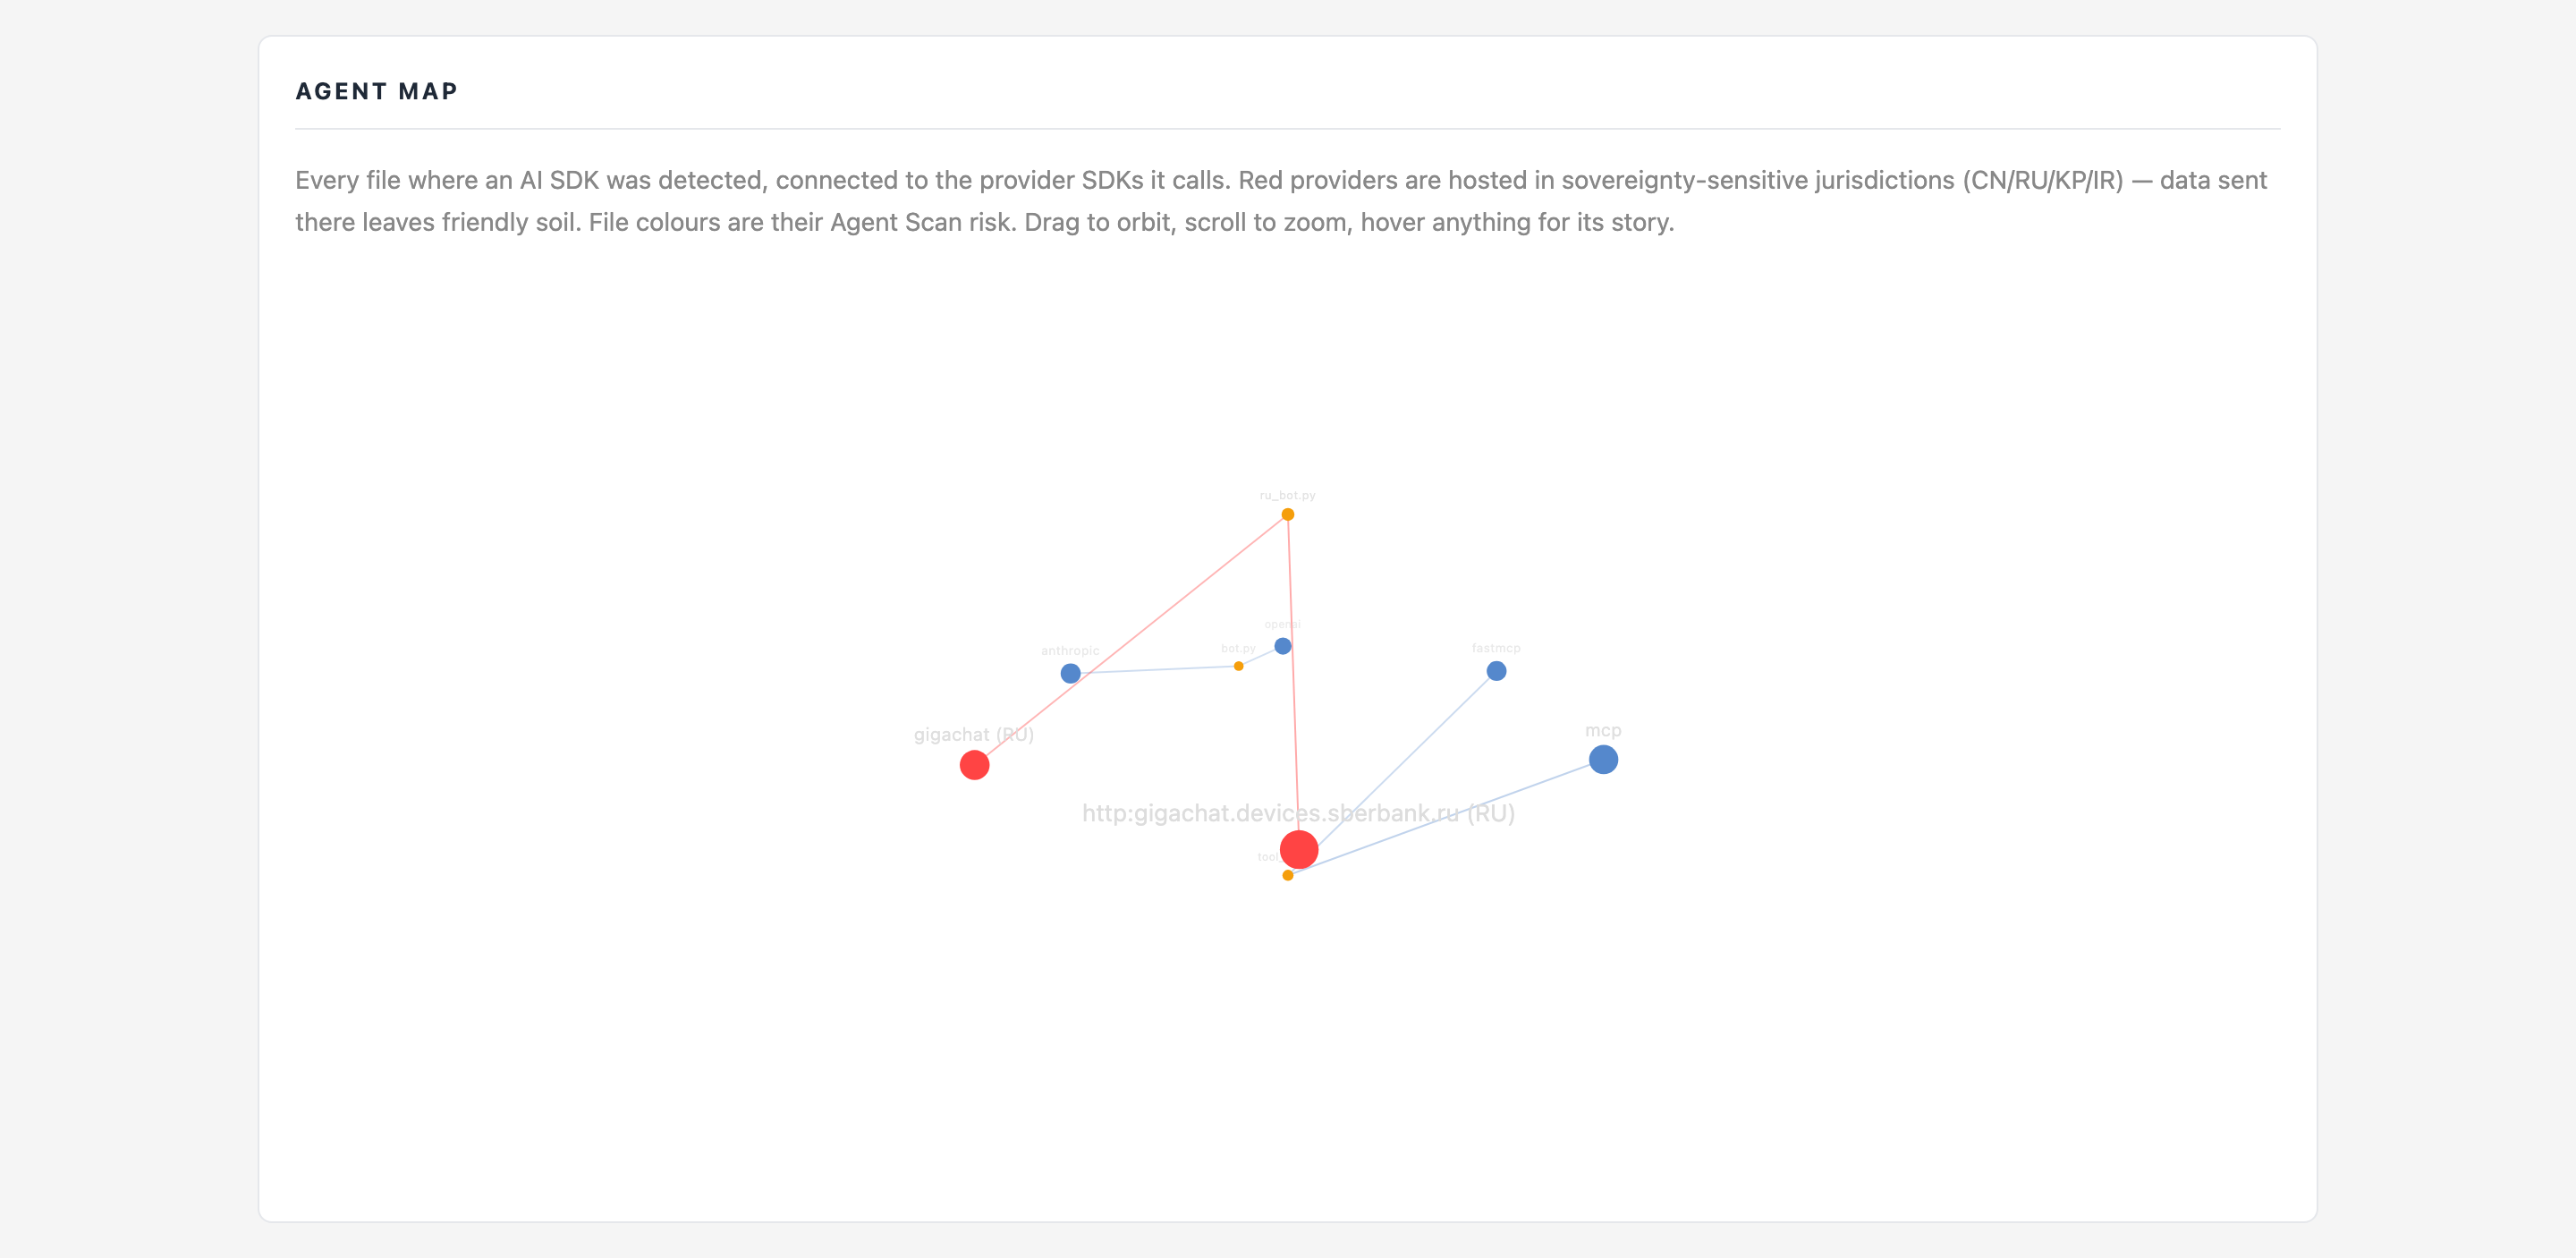
Also in the box, without a picture: the AI bill of materials (native and CycloneDX) and the policy gate (--gate) that blocks unapproved providers in CI; the baseline that fails a merge only on new findings. CLI / CI reference.
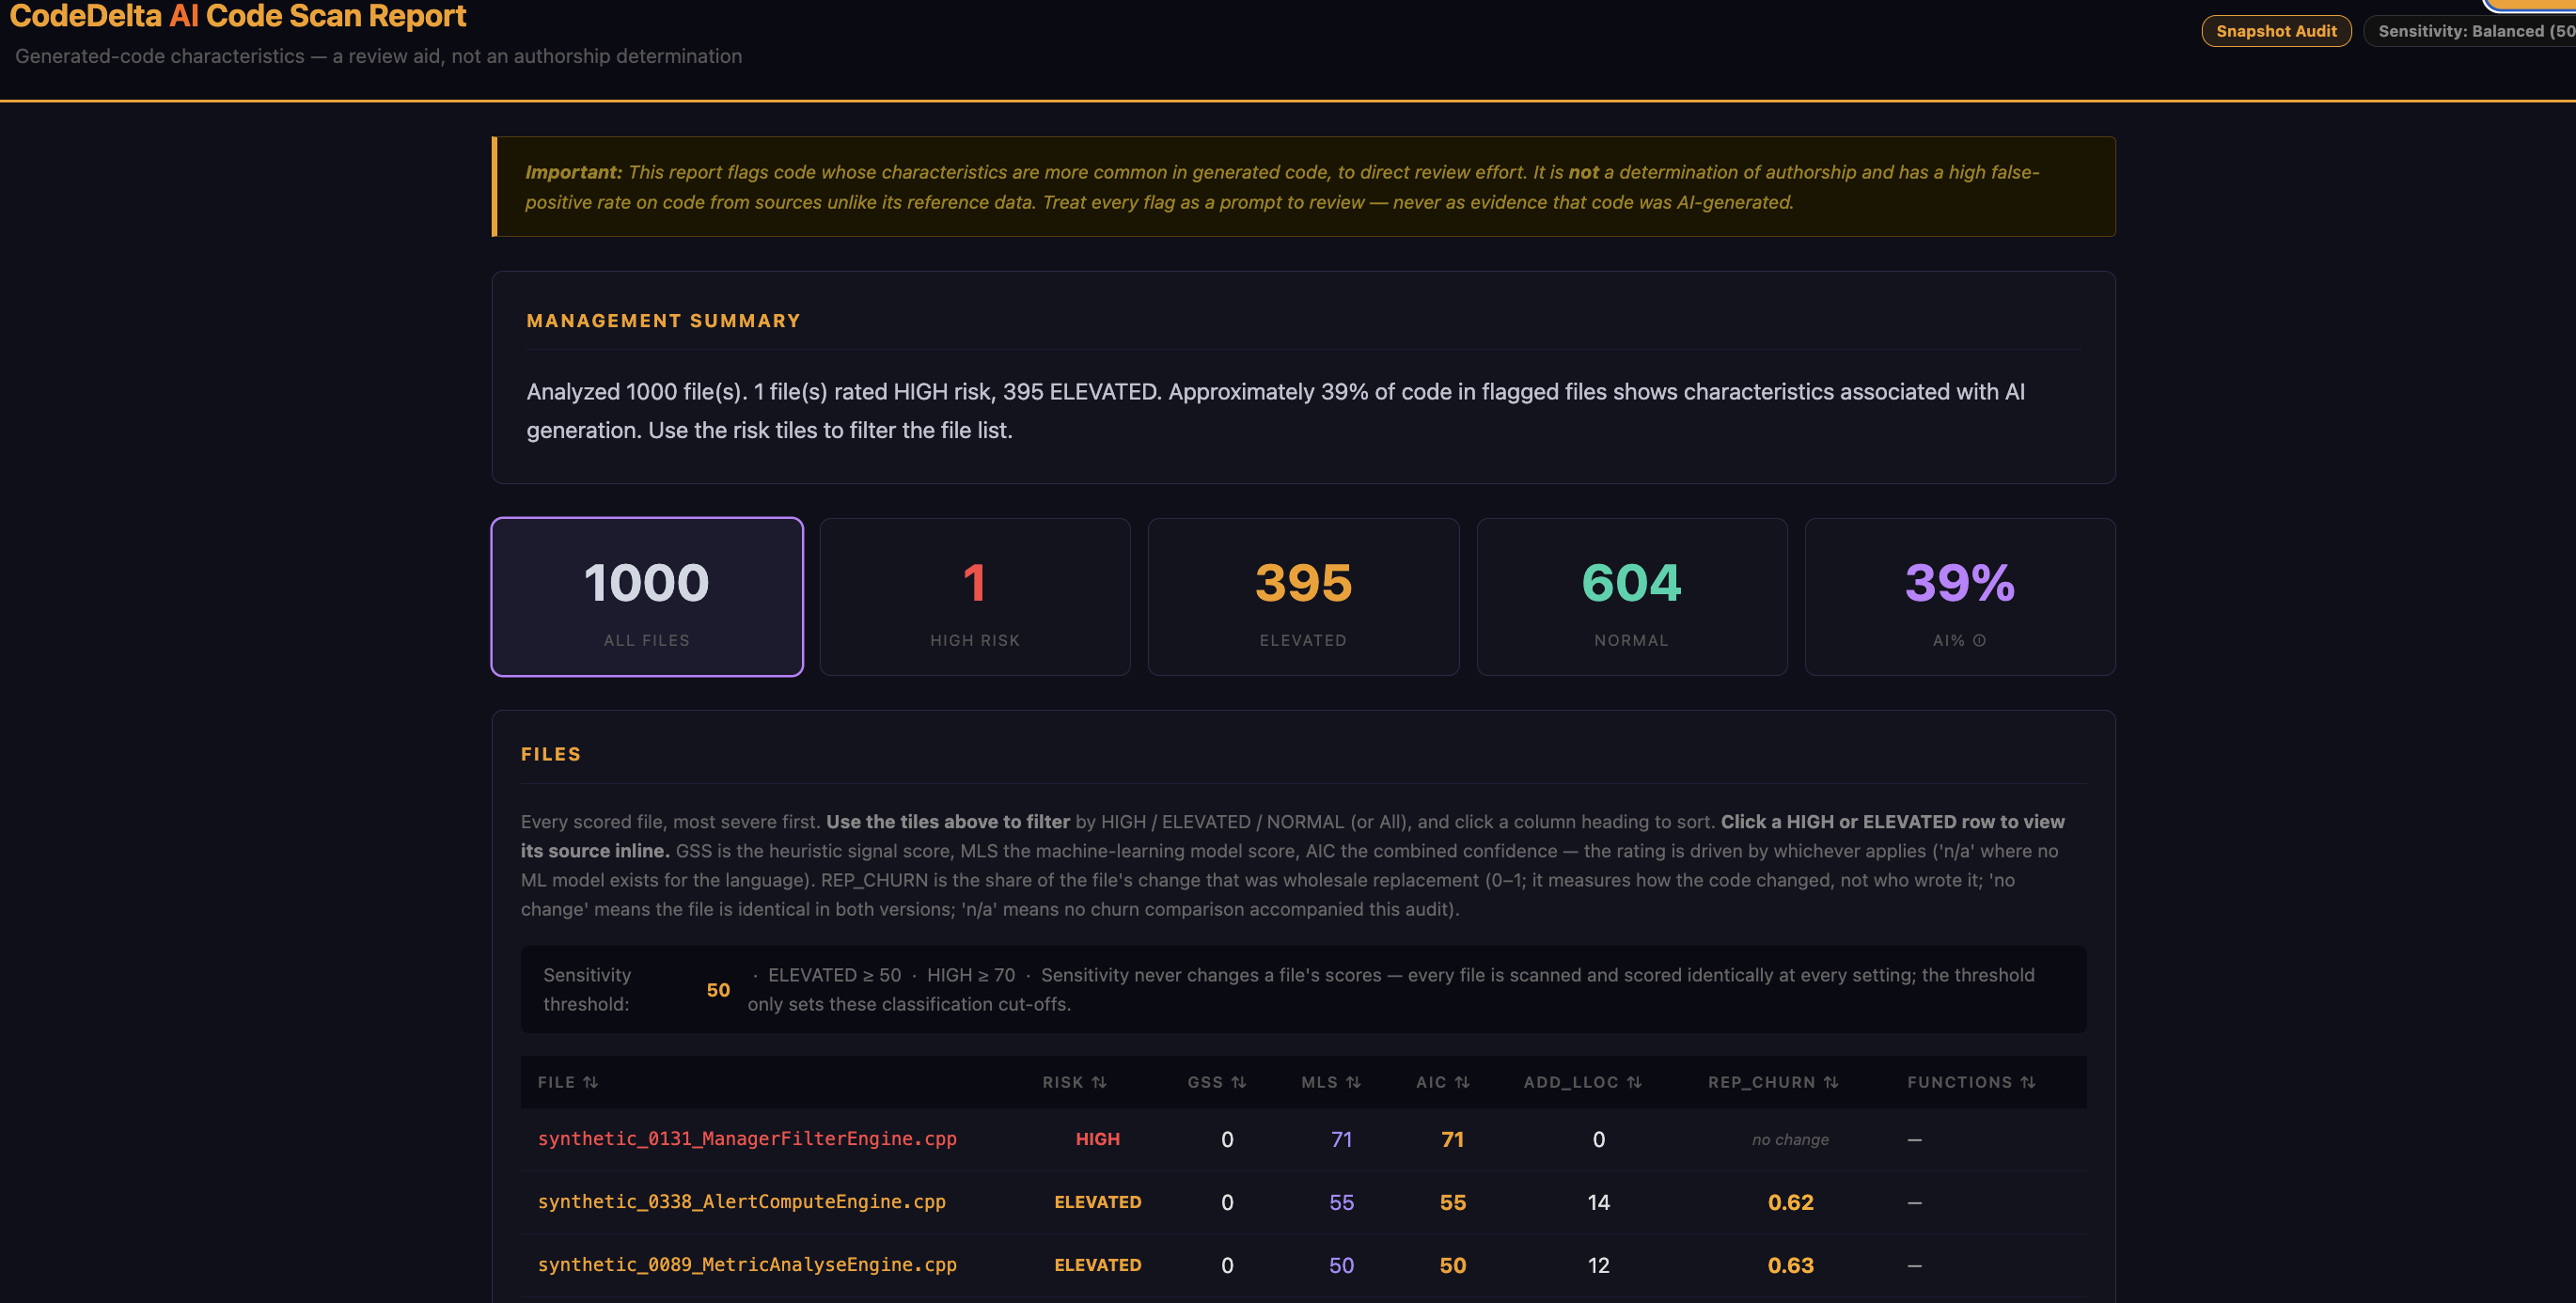
Files scored for generated-code characteristics — HIGH, Elevated, Normal — as a review aid. It tells you where to look first; it never claims to know who wrote a line. The paper says exactly what it can and cannot do.
Two lines in a workflow file. On every pull request, inside your own runner: the churn summary and agent findings as a PR comment, SARIF into the Security tab, and an optional merge gate. The engine downloads itself; a licence is built in for the beta.
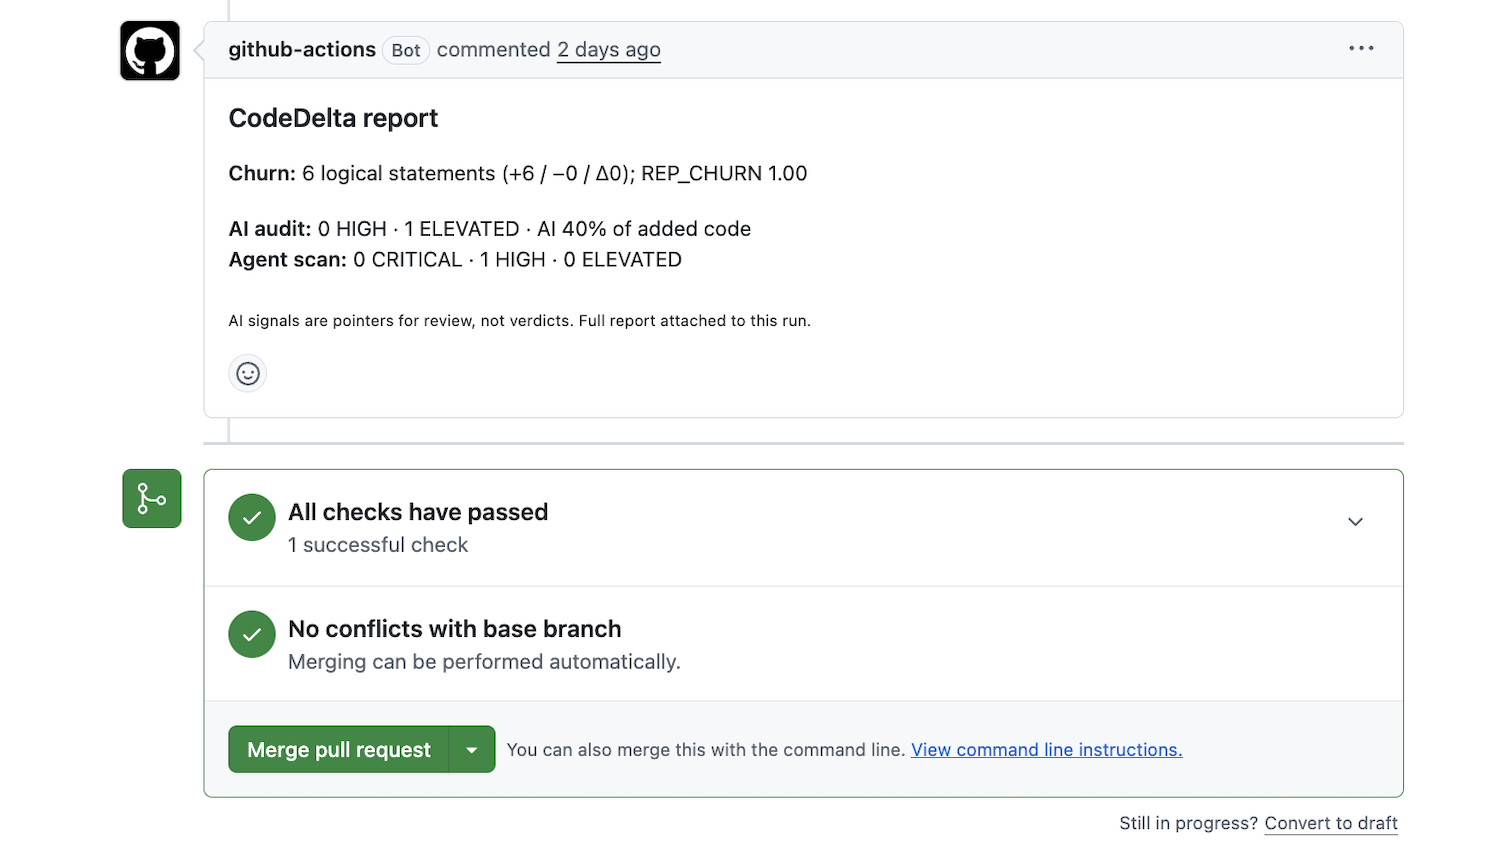
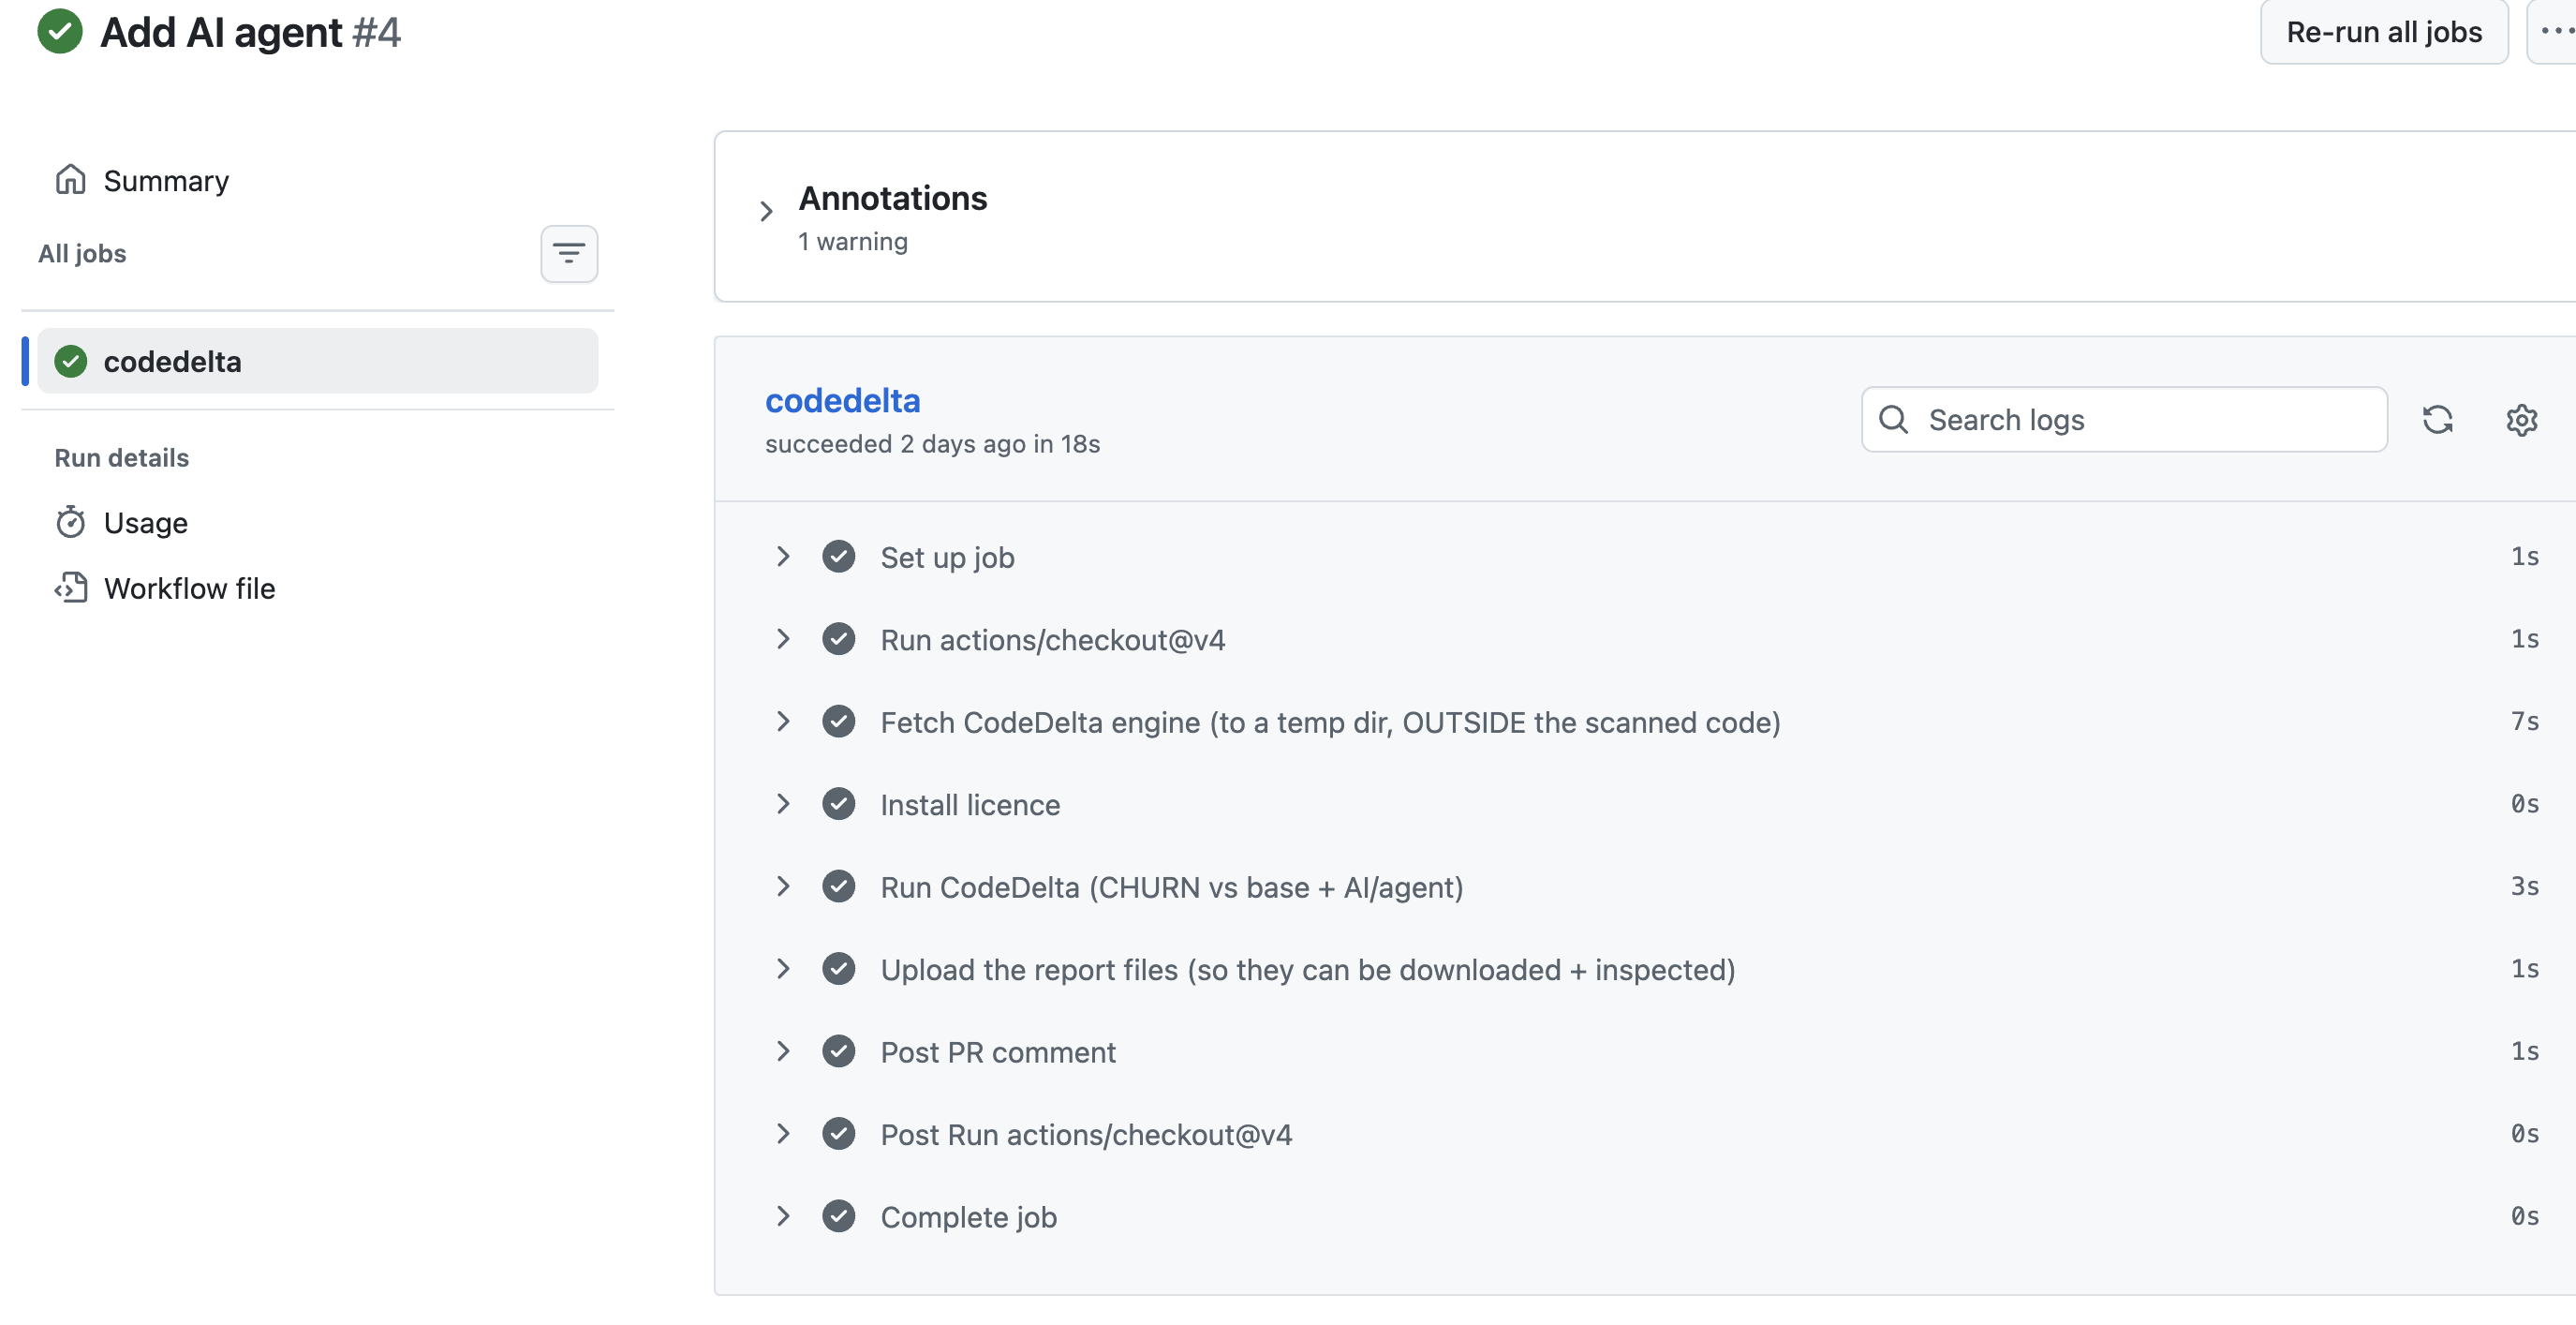
Set it up in five minutes · See it on a real PR · an MCP server lets your own agents call the engine (CLI / CI).
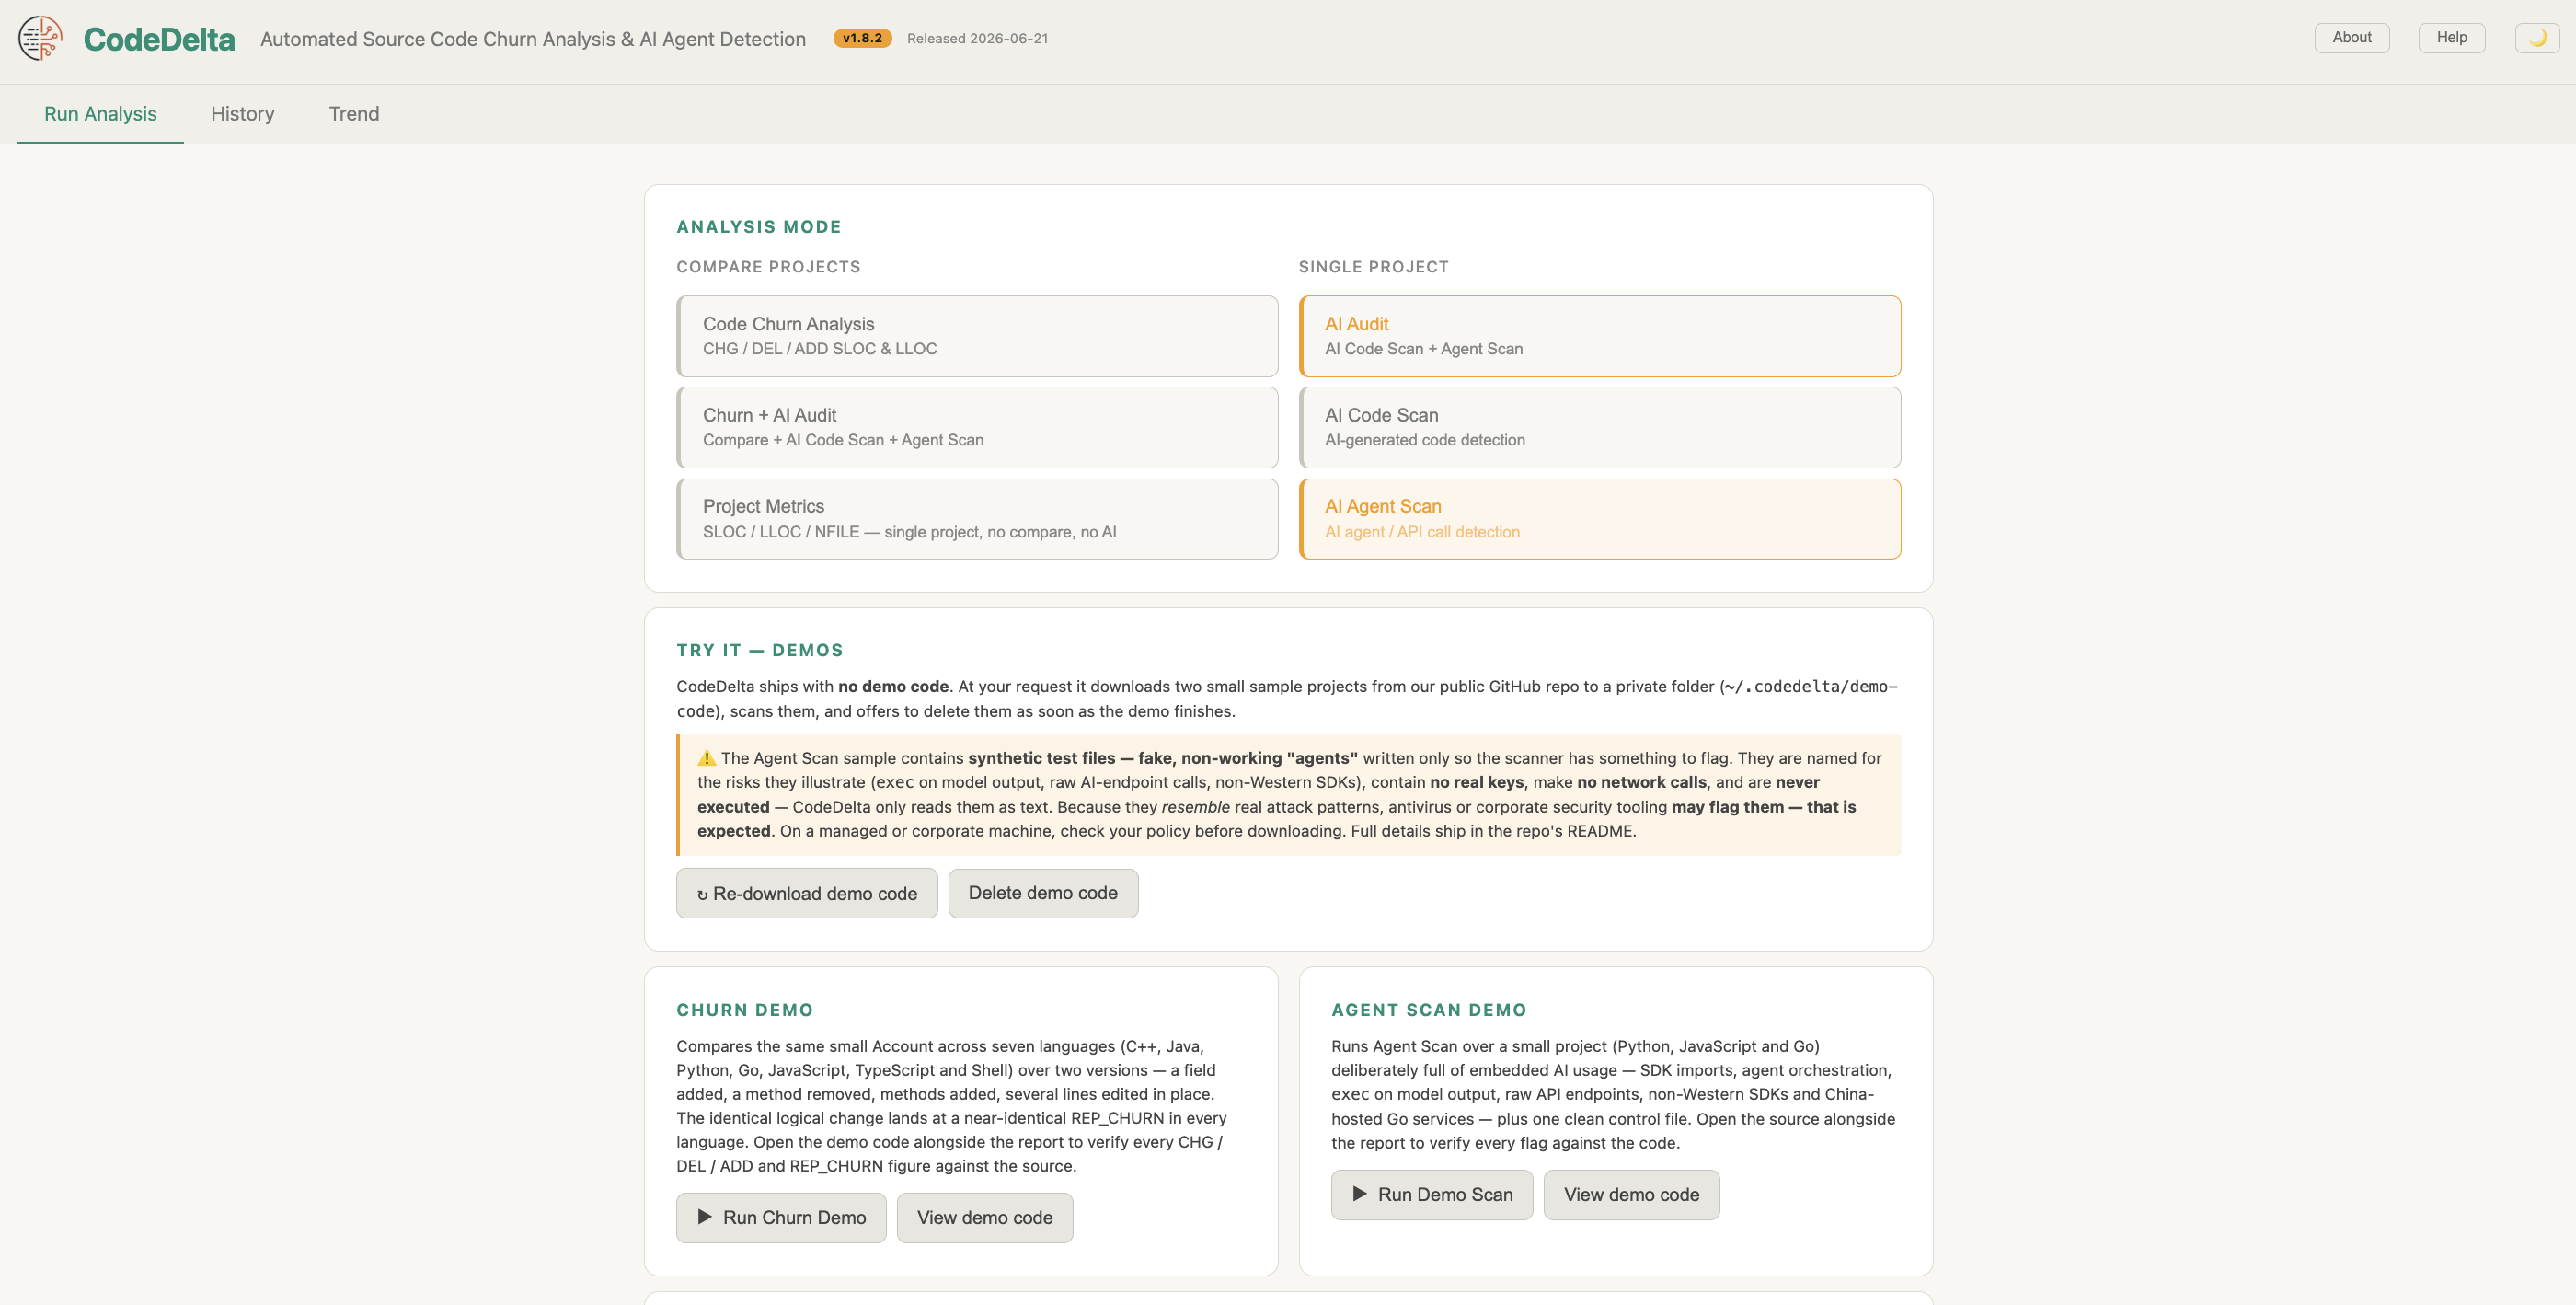
macOS, Windows and Linux. Pick a mode, point it at two snapshots or one project, and read churn, the AI code scan, the agent scan and the Code Browser in one local window — nothing phones home.
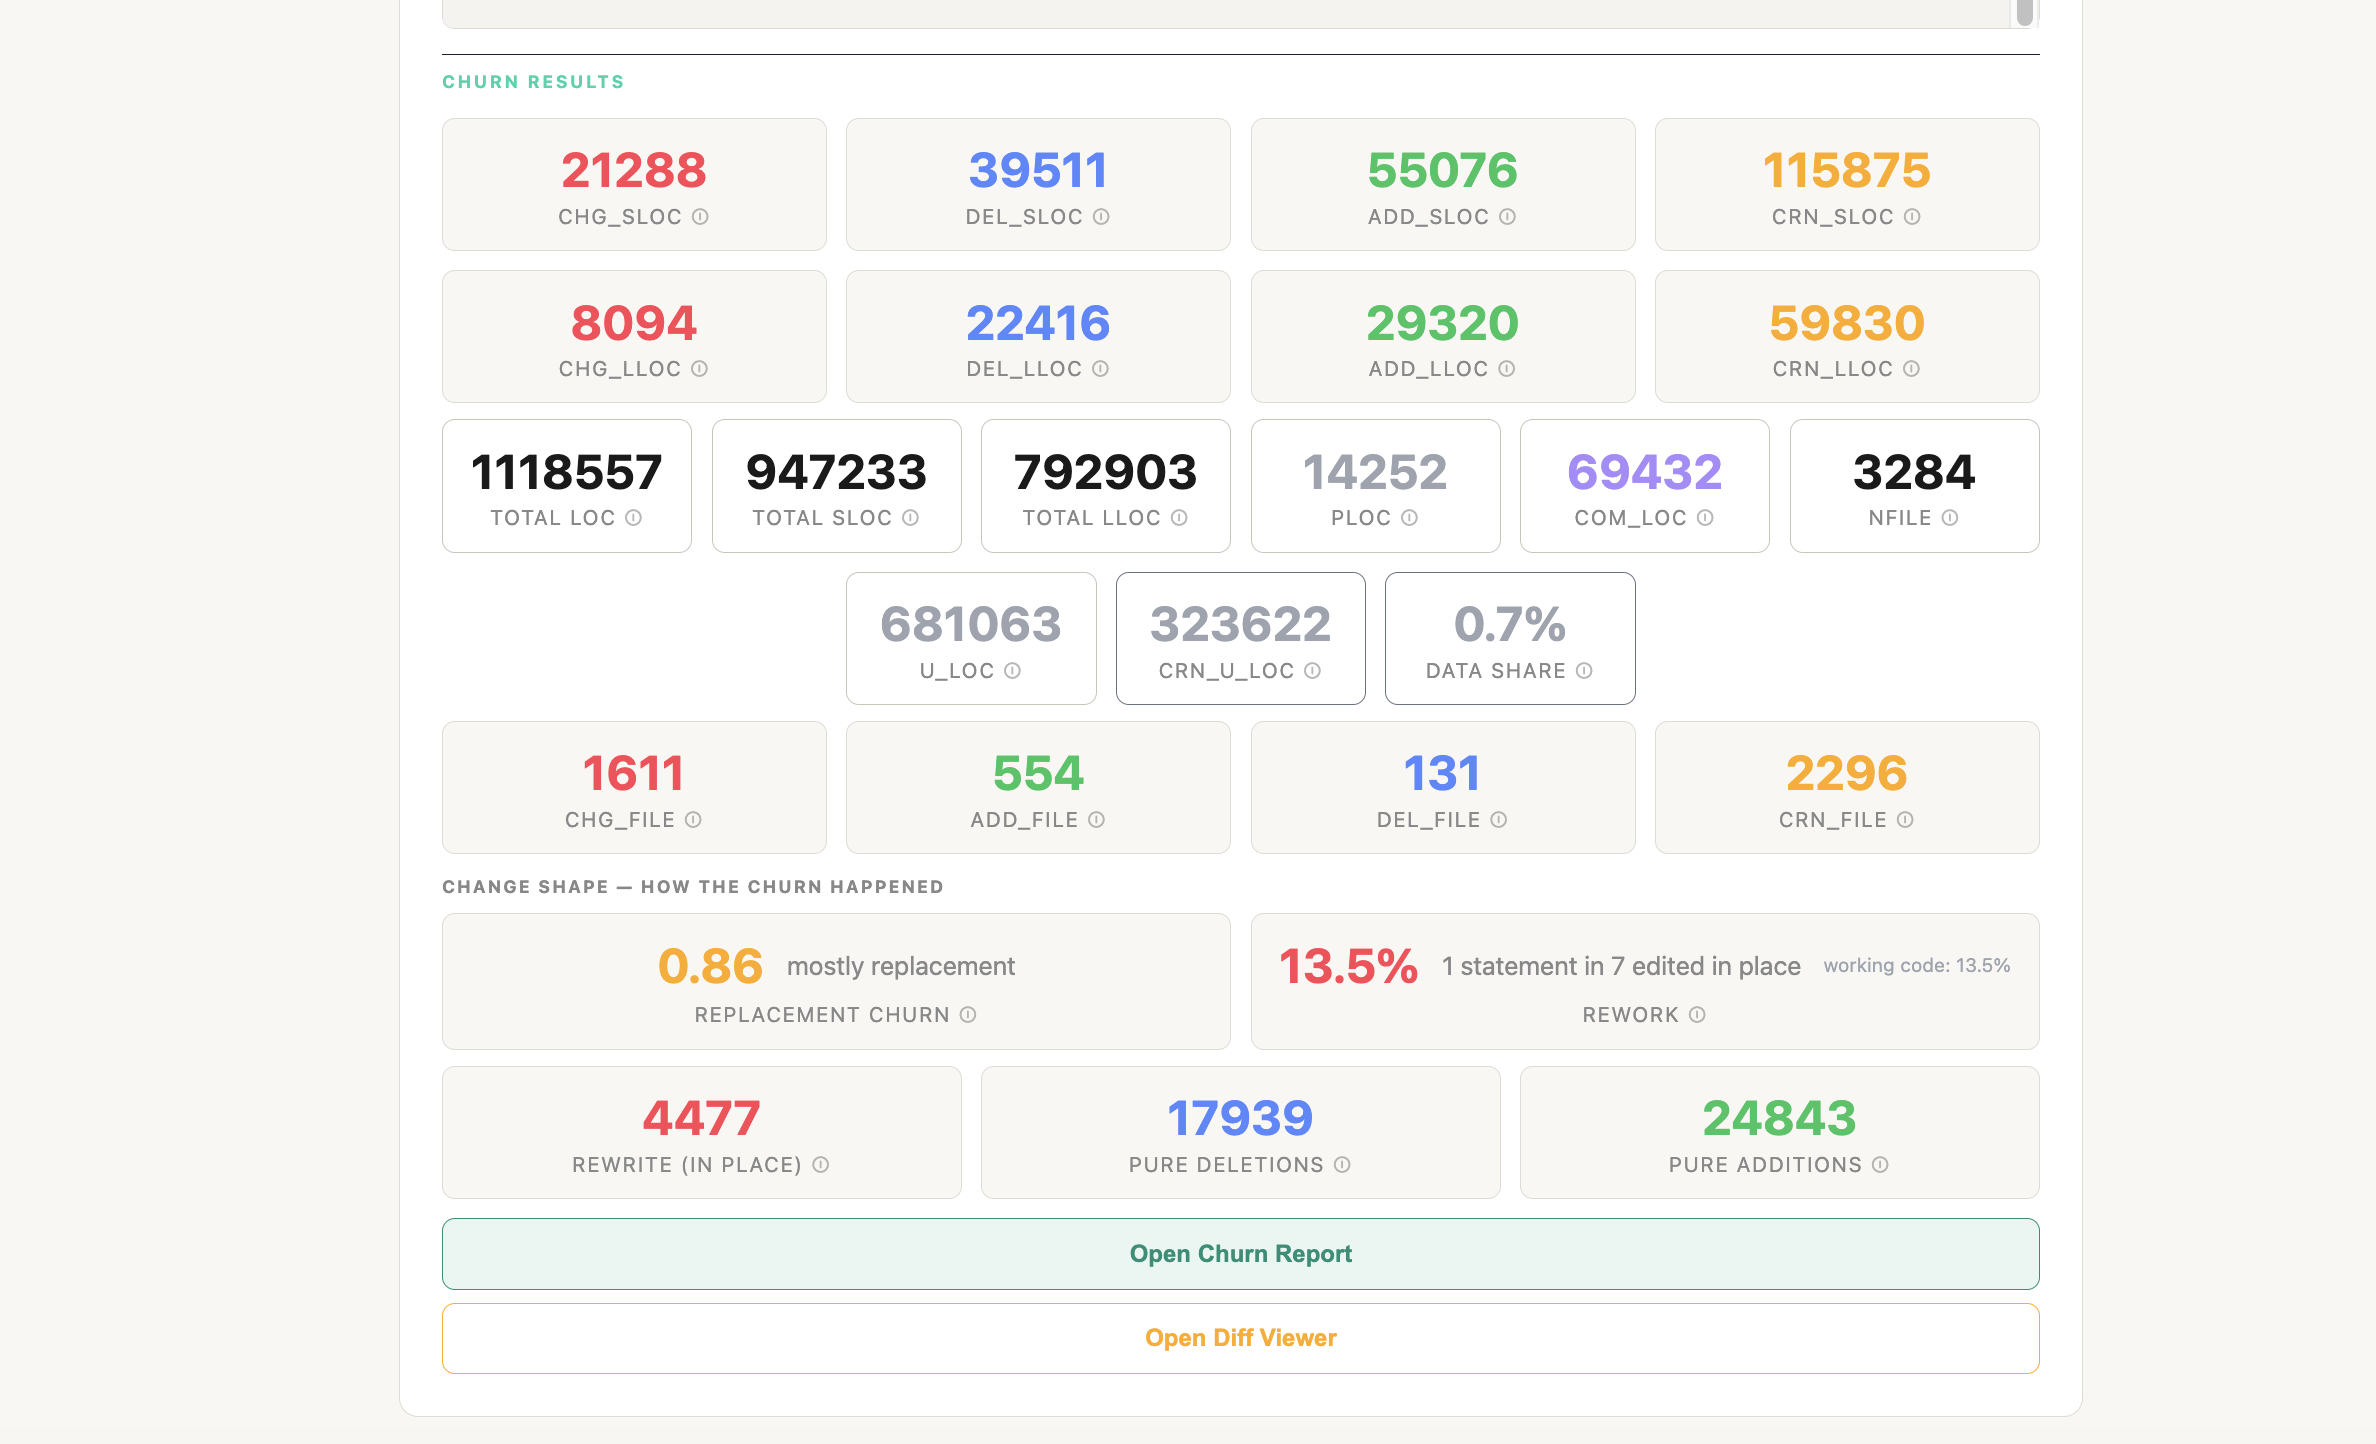
The files that control how a project builds and ships — Makefiles, CI pipelines, packaging, dependency manifests — are where supply-chain backdoors such as xz-utils actually entered. When a scan compares two versions, CodeDelta lists every build file that changed. It’s computed with no ML and no scoring — pure determinism: both directory trees are walked and every filename is checked against a rule table (exact names like Makefile, Dockerfile, package.json; tell-tale suffixes like .m4, .spec; locations like .github/workflows/ where a yml file is executable CI). Each recognised file gets a category — build definition, CI/CD, packaging, dependency manifest. Then the two lists are compared: in new only = ADDED, in old only = DELETED, in both = the bytes are compared and if they differ = MODIFIED.
Why it matters: code review reads
source diffs — and the xz-utils payload never appeared in one. It entered through an
edit to an autoconf .m4 build file that no source reviewer would open. Churn in
build machinery is rare and disproportionately consequential, which is exactly the profile
that deserves an alert rather than a line in a table. One honest limit: this catches the
conventional build surface — a determined attacker can invoke an arbitrarily
named script from a build, so it is coverage of the known surface, not a guarantee.
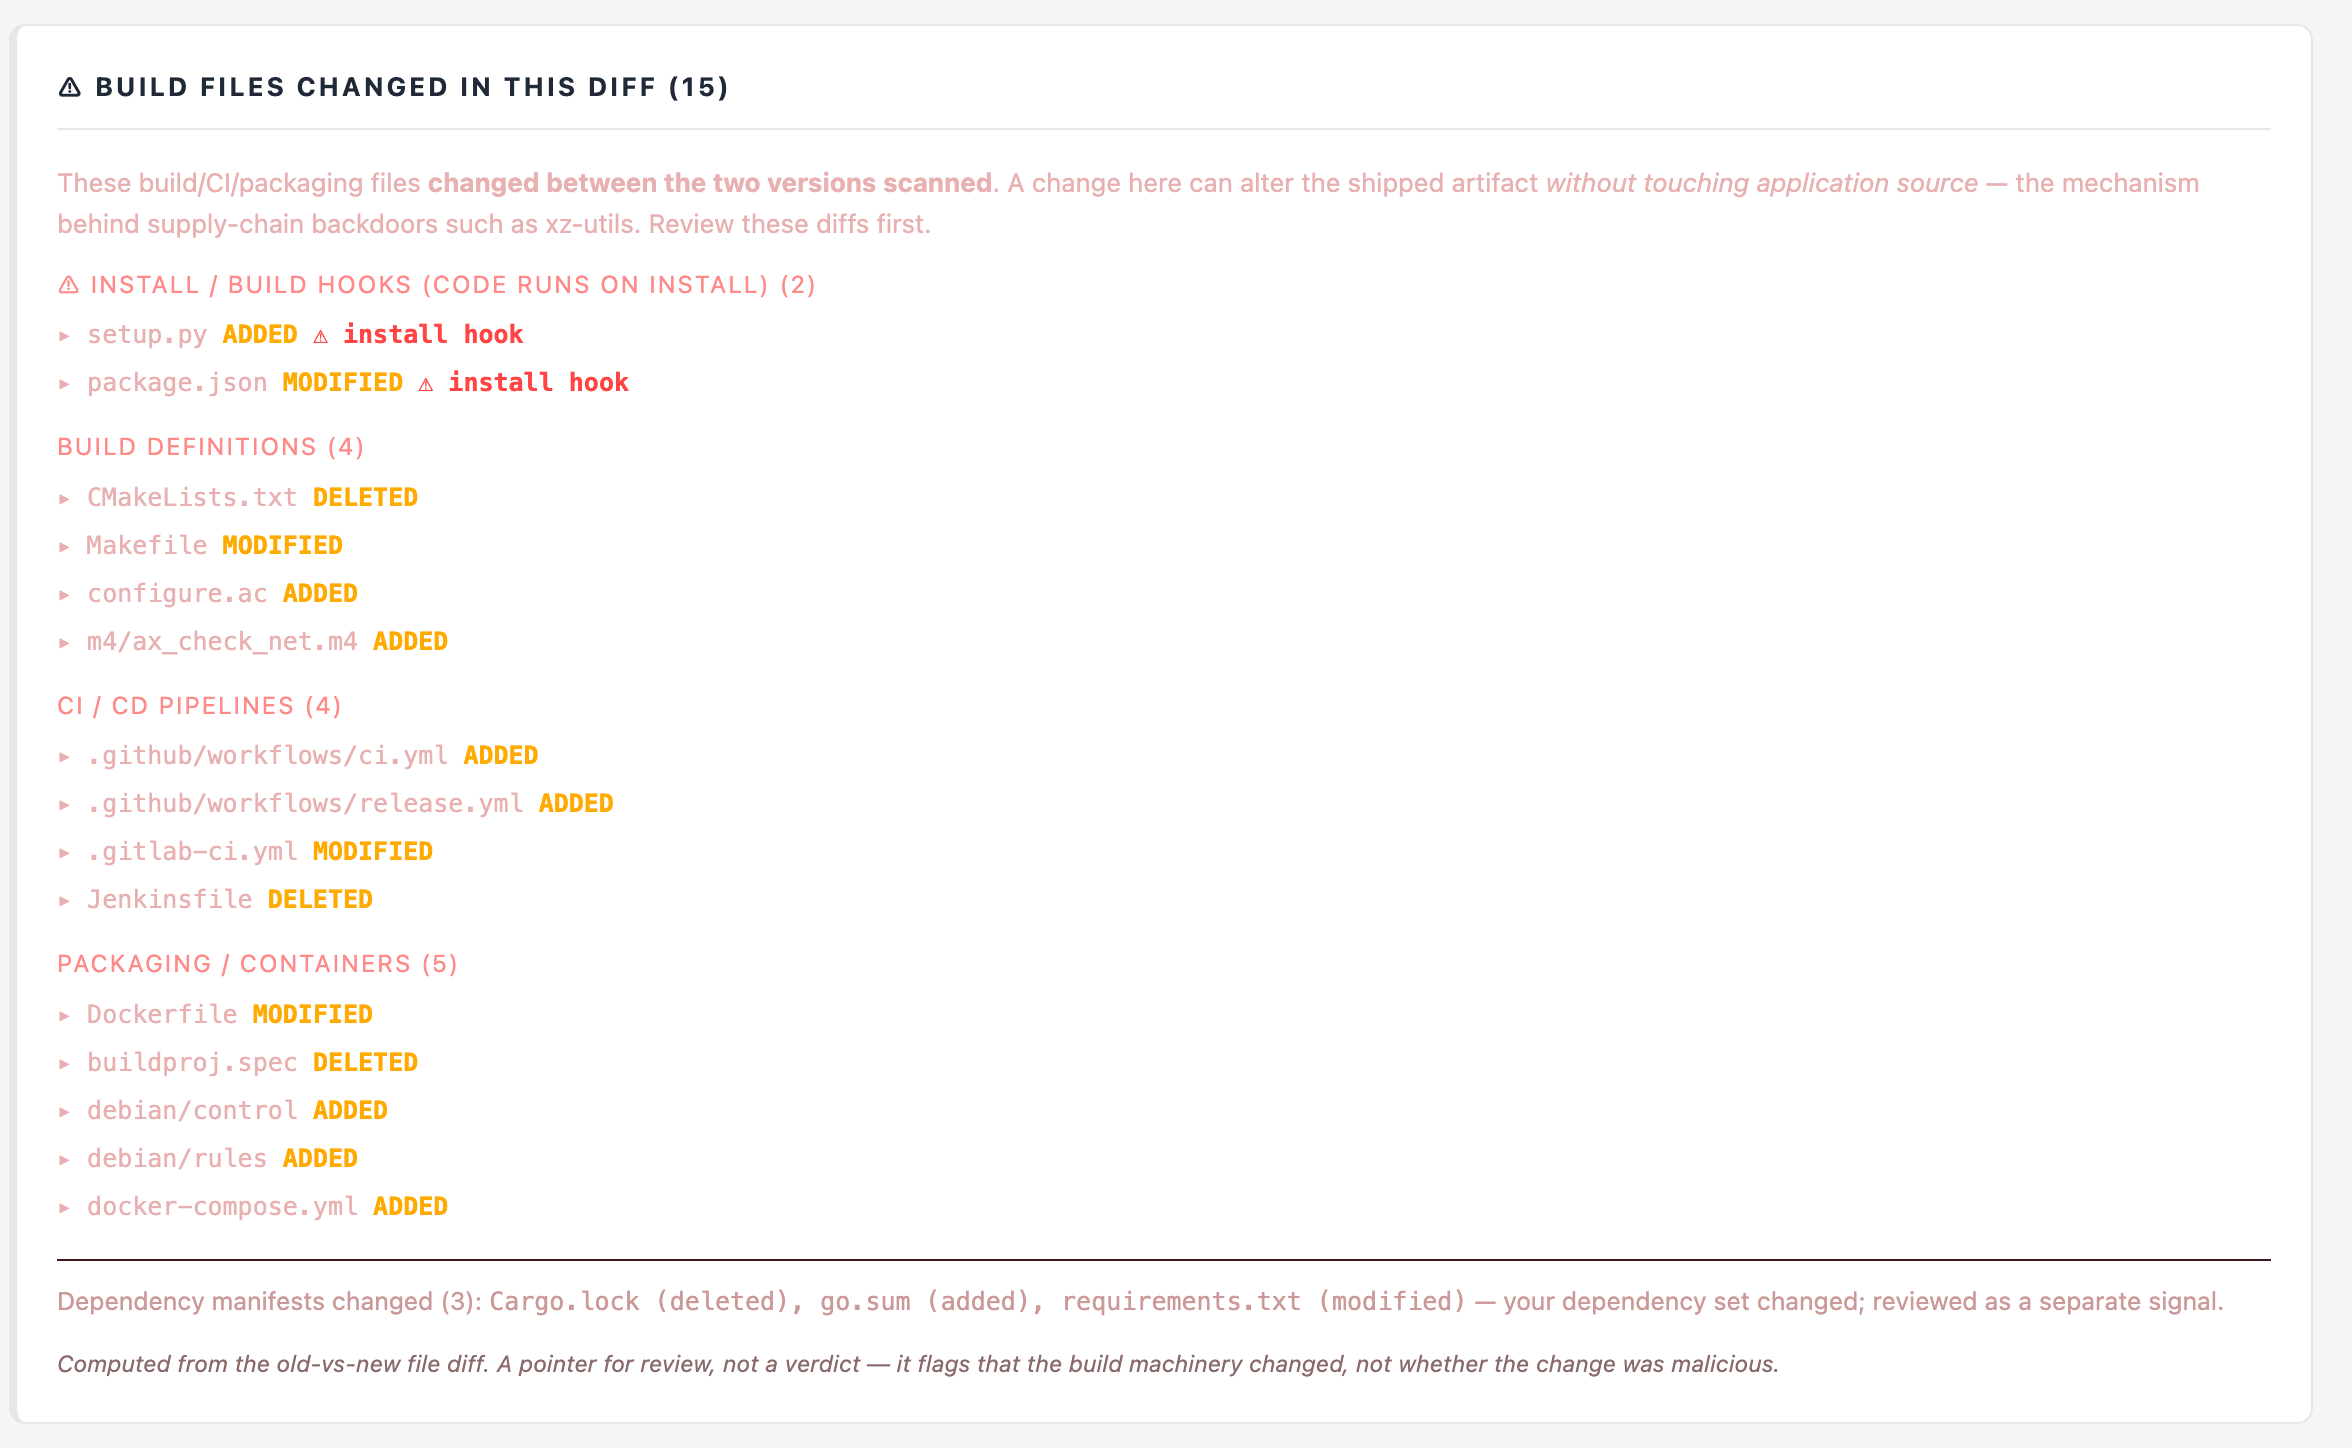
package.json that gains a postinstall, a setup.py with a cmdclass override, code that runs the moment someone installs — head the table whatever their category. Dependency manifests sit in the quieter line below because they change constantly and red-flagging them would desensitise the alert.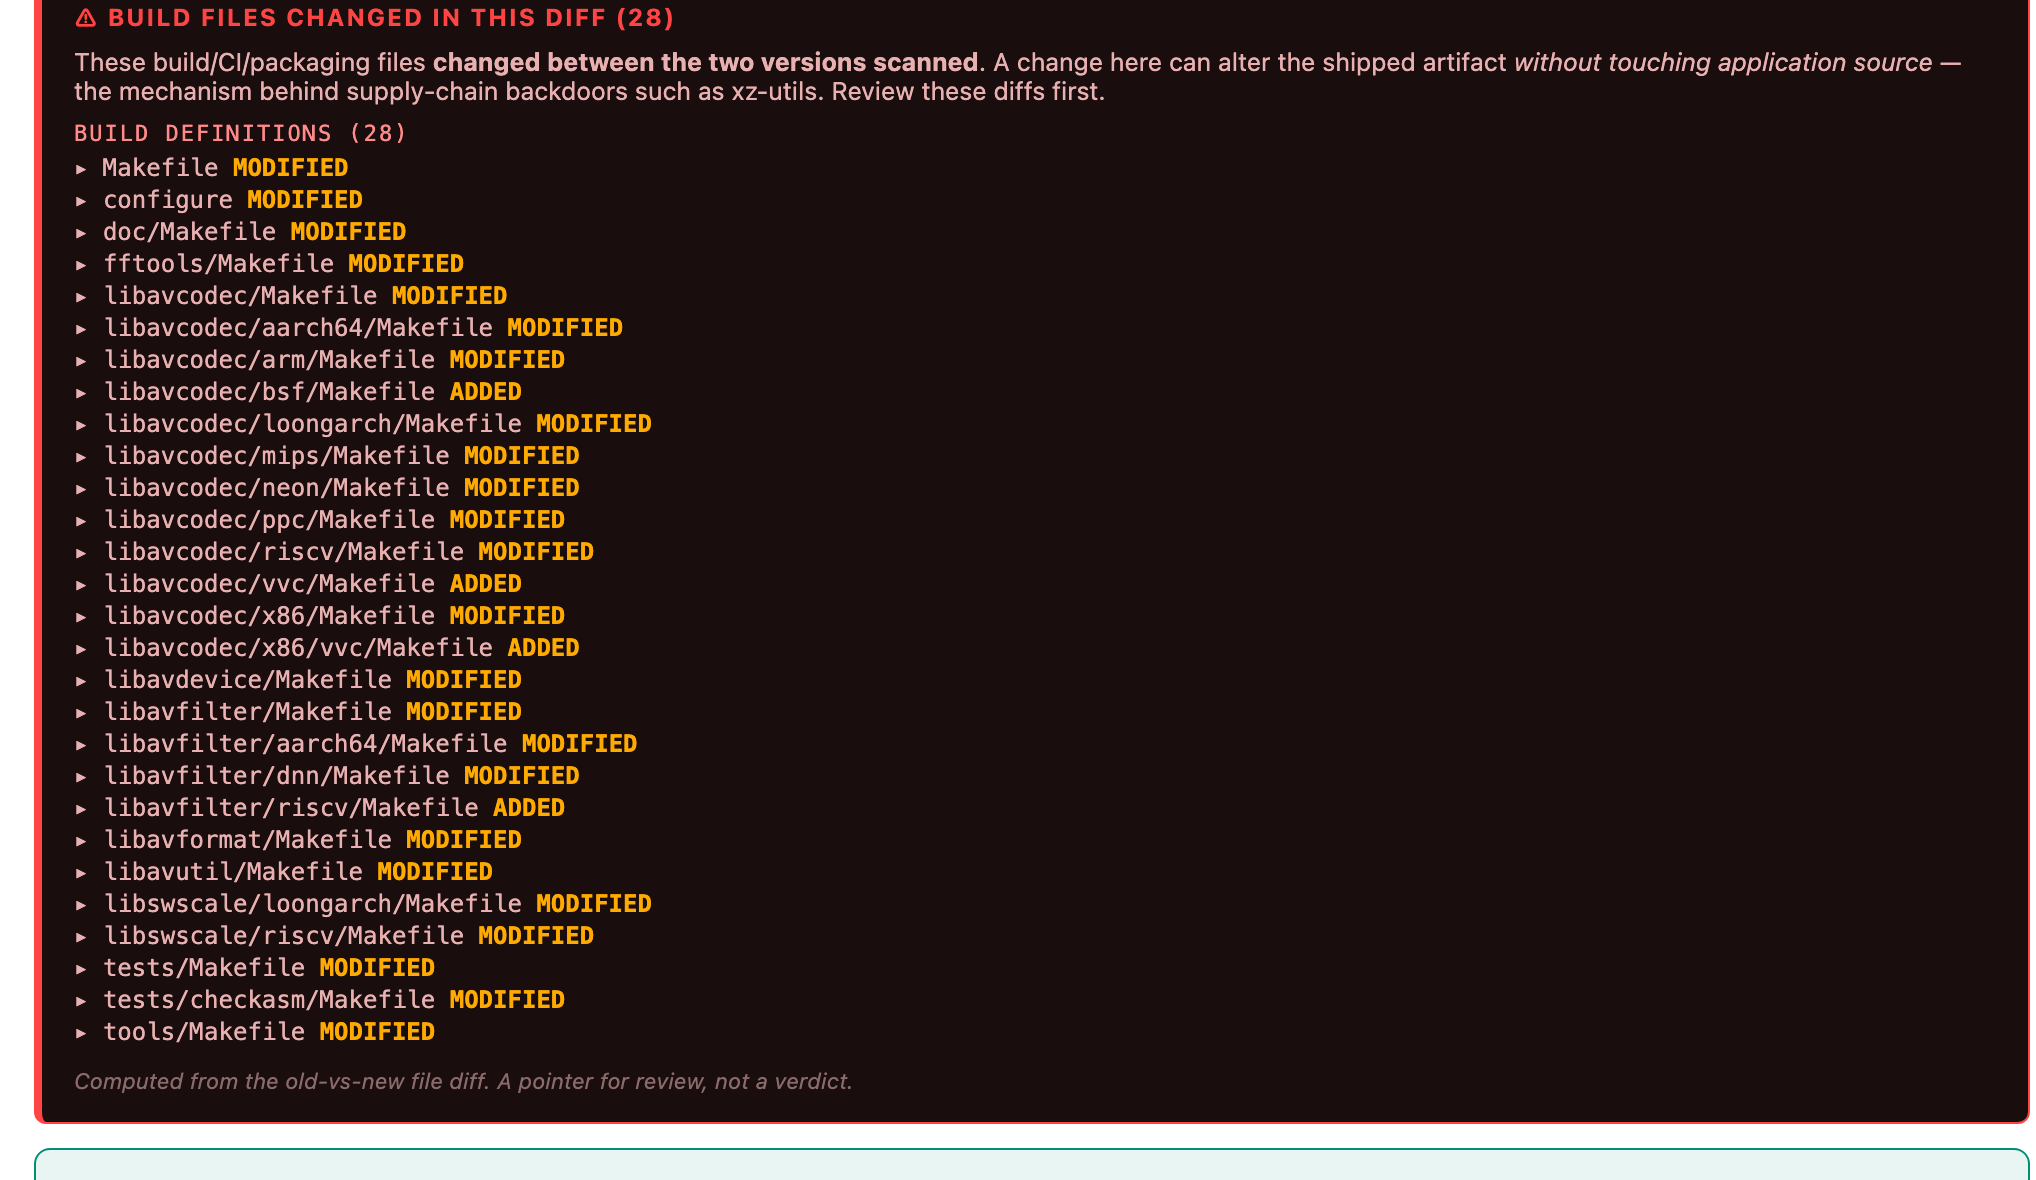
configure, the root Makefile and the per-architecture Makefiles across the codec libraries. Exactly the class of files the xz attacker edited.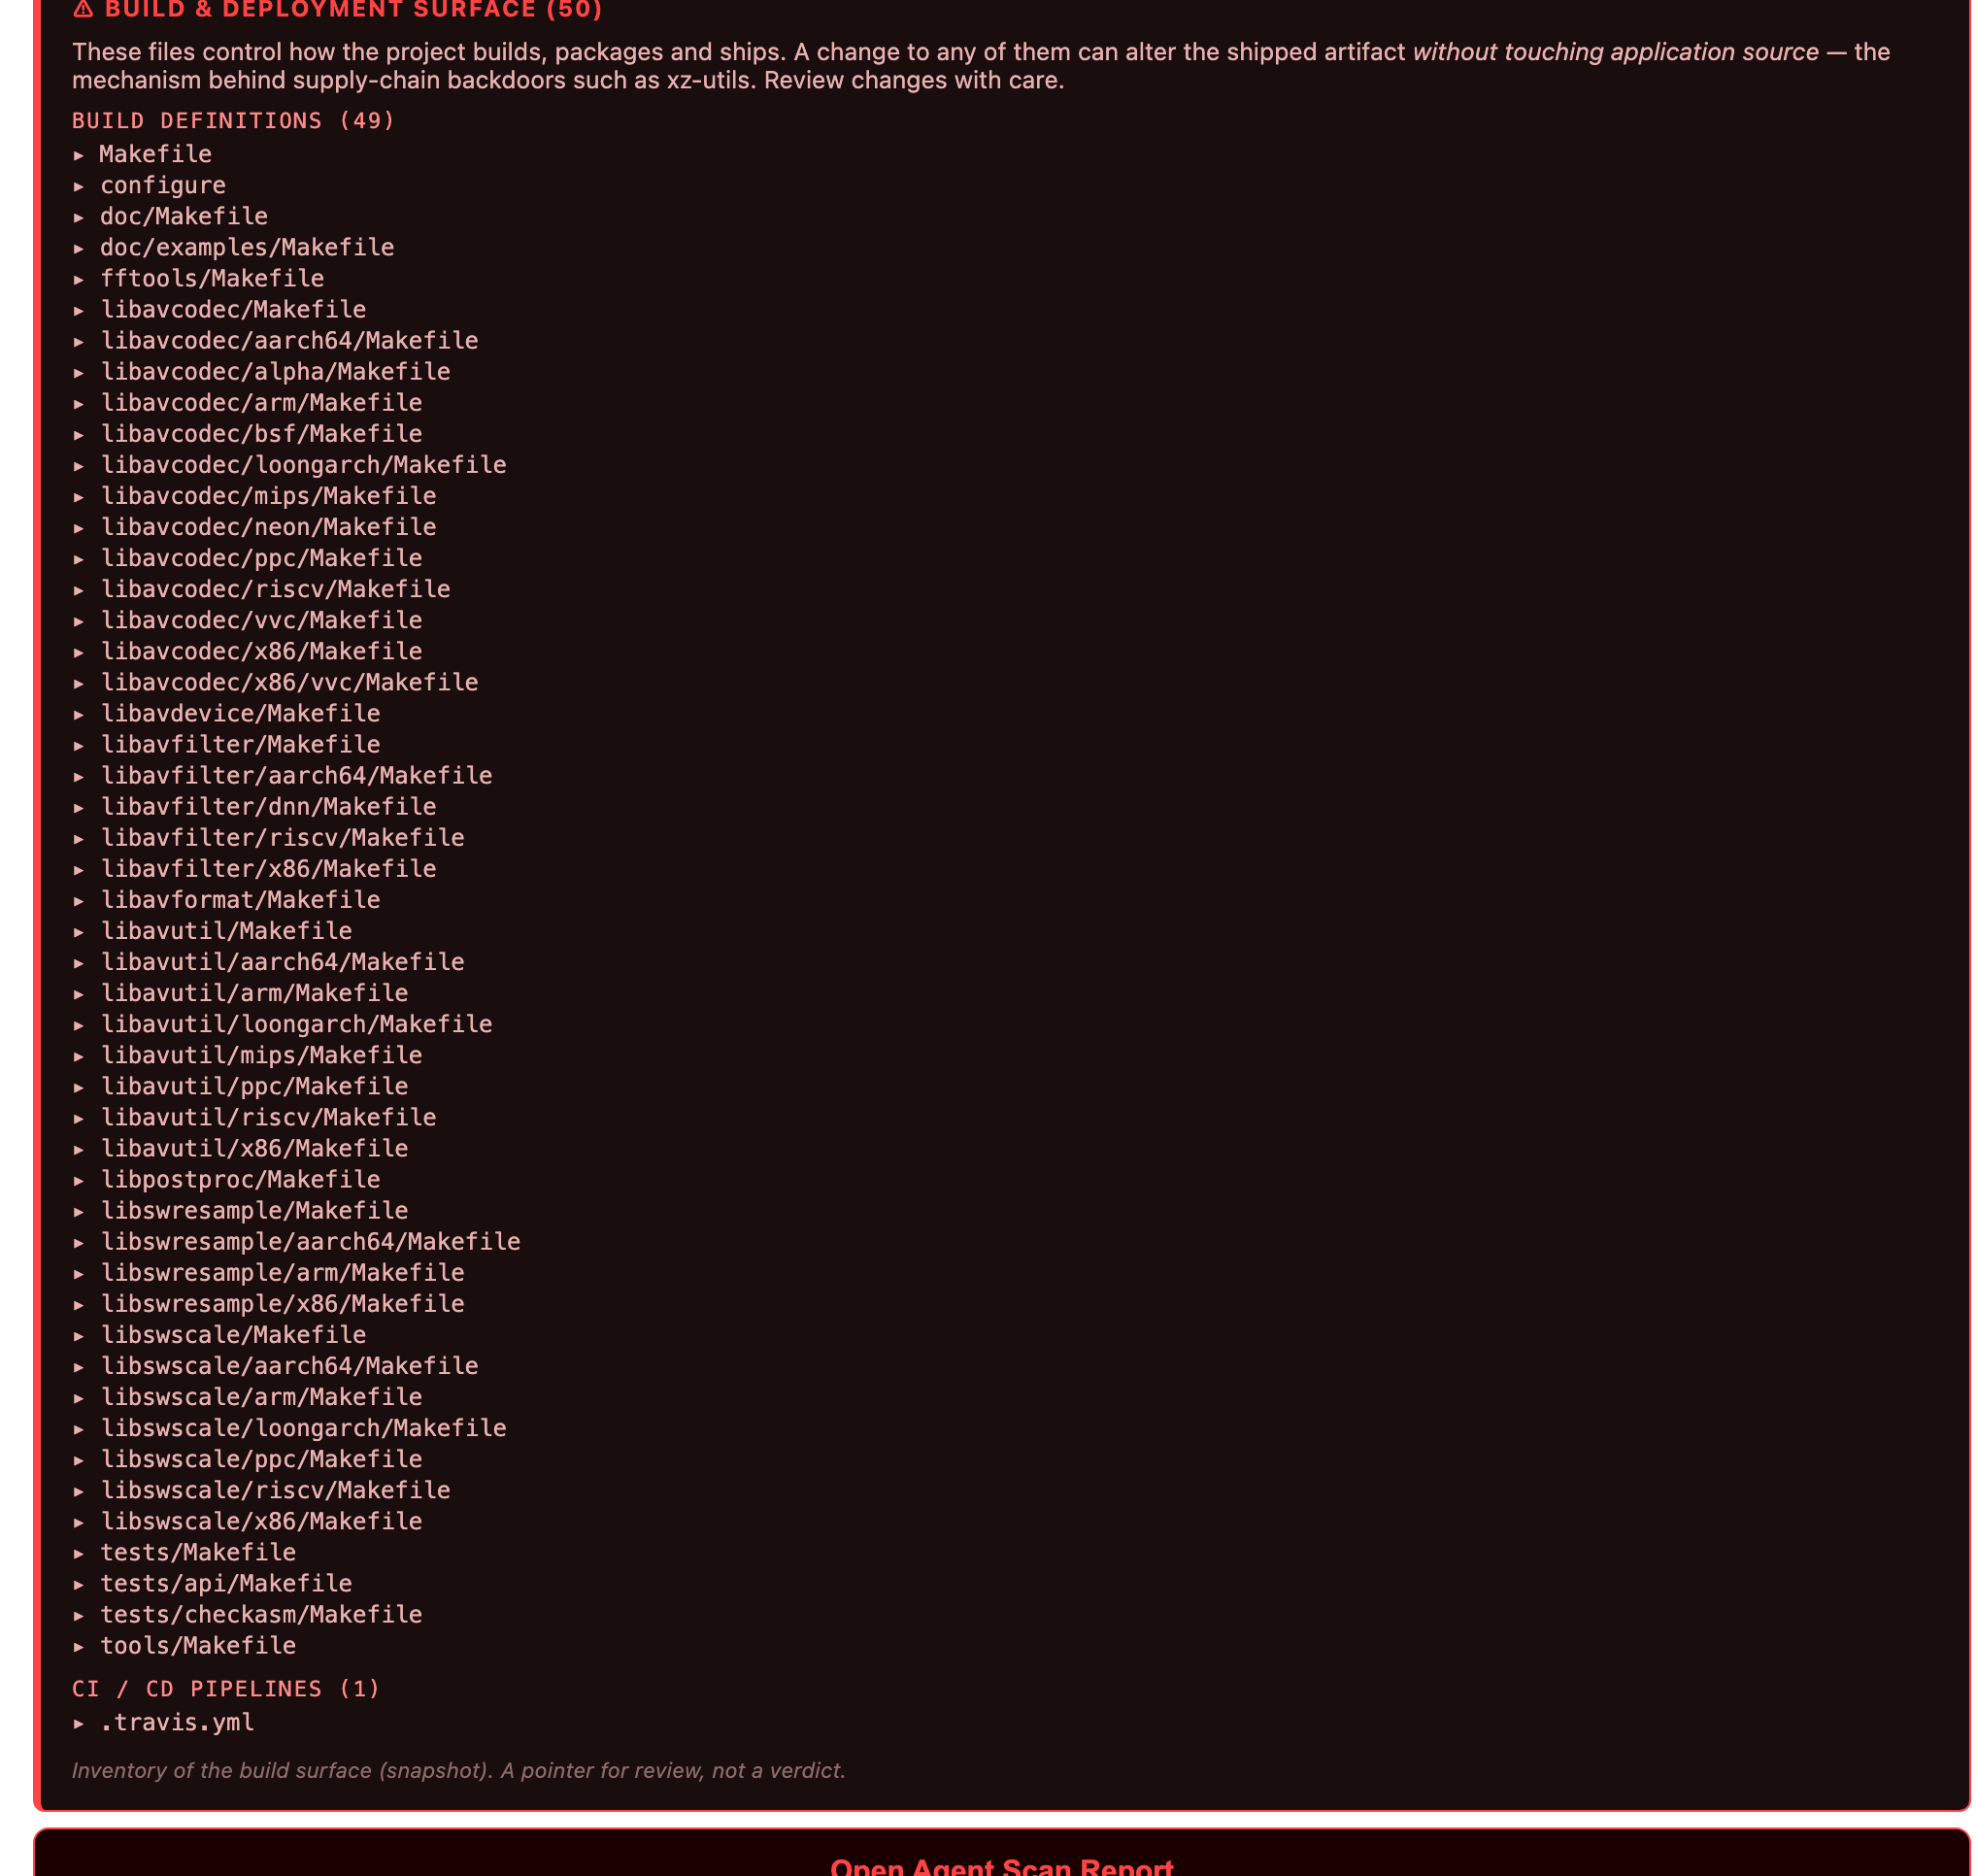
Run against two real curl releases (8.5.0 → 8.8.0) it flags 69 build-file changes — configure.ac, the .m4 macros, thirty CI workflows — exactly the surface the xz attacker used. Every agent report also carries the standing Build & Deployment Surface inventory of what build machinery exists in the tree. A pointer for review, not a verdict. Details in the user guide.
| Mode | Change alert (“changed in this diff”) | Presence inventory (“what exists”) |
|---|---|---|
| Churn | ✓ GUI box + CLI [build] lines | — |
| Churn + Agent Scan | ✓ + agent report + PR comment | ✓ |
| Both (churn + AI + agent) | ✓ + agent report + PR comment | ✓ |
| Agent Scan only | — (no pair) | ✓ |
| AI Audit | — (no pair) | ✓ |
| Metrics + Agent Scan | — (no pair) | ✓ |
| AI Code Scan | — | — |
| Metrics | — | — |
Every scan that compares two versions carries the change alert; snapshot scans have nothing to diff. The presence inventory rides every agent scan.